Automated GenAI tracing for agent and LLM experimentation in Domino
Author
Andrea Lowe
Product Marketing Director, Data Science/AI/ML
Article topics
GenAI tracing, LLM evaluation, agent observability, experiment tracking, responsible AI
Intended audience
Data scientists, ML engineers, AI governance teams
Overview and goals
The challenge
GenAI systems are multi-layered since a single user query might trigger retrieval calls, multiple LLM invocations, tool uses, and agent reasoning steps. Traditional experiment tracking captures inputs and final outputs but misses the nested execution tree that matters most for debugging and optimization. The result is fragmented experimentation across heterogeneous tools, which creates blind spots and makes it difficult to see which component failed. This also leads to ad-hoc evaluations without consistent metrics. For example, how do you know if the new prompt is actually better?
Teams need framework-agnostic instrumentation that works across tools such as LangChain, LlamaIndex, OpenAI SDK, or raw HTTP calls without requiring extensive code changes. They also need trace-level granularity: the ability to evaluate individual spans, not just end-to-end performance, and to compare configurations at the trace level to understand exactly where differences emerge.
Beyond the technical challenges, governance teams lack the audit trails and evaluation histories required for compliance in regulated industries.
The solution
Domino now provides GenAI tracing that unifies experiment tracking, LLM instrumentation, agent observability, and automated evaluation, without requiring major code changes. By extending MLflow's experiment tracking with deep tracing capabilities, Domino captures every function call, agent decision, and LLM interaction within your workflow. Here, you’ll learn how to set up universal instrumentation via a single line decorator (@add_tracing) that works with numerous GenAI libraries including the OpenAI SDK, Anthropic, LangChain, Pydantic AI, or custom code. This will automatically create nested span trees with full input/output/latency details for every trace, which include detailed audit logs and automatic evaluators if desired.
When to consider GenAI tracing in Domino
- Building multi-step AI systems: Your application uses agents, RAG pipelines, or chains of LLM calls where understanding the execution flow is critical for debugging and optimization.
- Evaluating systematically: You're testing prompts, retrieval strategies, or model configurations but lack structured ways to measure and compare performance across iterations.
- Requiring audit trails: You need to show exactly what your system did, which models were called, and how outputs were generated.
- Debugging complex failures: Your GenAI system produces unexpected results and you can't pinpoint whether the issue is in retrieval, reasoning, tool selection, or synthesis.
- Collaborating on system quality: Data scientists, ML engineers, and domain experts need a shared view of system behavior to review, annotate, and improve applications together.
How to set up multi-step GenAI tracing in Domino
The project demonstrates Domino's GenAI tracing and evaluation capabilities through a multi-agent system that automatically triages incoming incidents like security alerts, service disruptions, compliance issues, or operational failures by classifying them, assessing impact, assigning responders, and drafting stakeholder communications.
Incidents flow through four specialized agents:
- ClassifierAgent - Categorizes the incident and assigns urgency
- ImpactAssessmentAgent - Evaluates blast radius, affected users, and financial exposure
- ResourceMatcherAgent - Identifies available responders based on skills and SLA requirements
- ResponseDrafterAgent - Generates communications tailored to each stakeholder audience
Each agent uses dedicated tools to query historical data, check resource availability, and apply organizational policies. Domino’s GenAI SDK lets you implement the capture of the token usage, latency, model parameters, cost, tool calls, and any errors or exceptions for each agent that is called. The pipeline includes optional LLM-as-judge evaluators that use a separate model call to score classification accuracy, response quality, and overall triage appropriateness, providing automated quality assessment that can be aggregated alongside your other metrics.

Step 1. Environment setup
To use Domino's GenAI tracing features, you need to add the Domino Python SDK and MLflow 3.2.0 to your compute environment:
1. Navigate to your Environment (Govern tab → Environments page) and select “Edit Definition.” Note that you may need to create a duplicate if you’re using a Global Environment.
2. Add the commands below to the Dockerfile Instructions section.
USER root

RUN pip install mlflow==3.2.0
RUN pip install "dominodatalab[agents] @ git+https://github.com/dominodatalab/python-domino.git@release-2.0.0"

USER ubuntu
3. Rebuild the environment by selecting build in the bottom right corner of the page.
For detailed instructions, see Preload Environment Packages in the Domino documentation.
Step 2. Project setup
To execute the full blueprint, make sure the code files from this repository are in your Domino project: you can import the repo and copy them over, create a fork of the repo and use that to build a Git-based project, or upload the files into a newly created project.
Step 3. Agent and tracing implementation
The tracing-tutorial.ipynb notebook will walk you through the creation and tracing of the multi-tool and agent workflow, which includes the optional LLM-as-judge evaluators.
Set up the multi-agent workflow
The notebook walks you through using OpenAI or Anthropic autologging, but you can use any MLflow auto tracing integration.
import mlflow
mlflow.openai.autolog() # or mlflow.anthropic.autolog()
Log configuration as parameters
There is an option to pass a YAML configuration file to DominoRun() to log your agent settings as parameters in the Experiment Manager. This allows for easy reproducibility and governance as these agents are deployed.
# config.yaml
models:
  openai: gpt-4o-mini
  anthropic: claude-sonnet-4-20250514

agents:
  classifier:
    temperature: 0.3
    max_tokens: 500
  response_drafter:
    temperature: 0.7
    max_tokens: 1500
Add tracing
The @add_tracing decorator will capture the token usage, latency, model parameters, cost, tool calls, and any errors or exceptions for each agent that is called. Evaluators are also defined directly in @add_tracing, enabling real-time quality assessment without a separate evaluation step.
from domino.agents.tracing import add_tracing

@add_tracing(name="triage_incident",evaluator=pipeline_evaluator)
def triage_incident(incident):
    # agent logic
    return result
Aggregate metrics
The DominoRun context captures statistical summaries (mean, median, standard deviation, and others) across all traces, making it easy to monitor classifier confidence, impact scoring consistency, and processing latency at a glance.
from domino.agents.logging import DominoRun

aggregated_metrics = [
    ("classification_confidence", "mean"),
    ("impact_score", "median"),
    ("response_quality", "stdev"),
]

with DominoRun(agent_config_path="config.yaml", custom_summary_metrics=aggregated_metrics) as run:
    for item in batch:
        result = triage_incident(item)
Step 4. Add ad-hoc evaluations
If desired, you can add evaluations after traces are generated using search_traces() to retrieve traces from the run and log_evaluation() to attach scores to specific traces.
from domino.agents.tracing import search_traces, log_evaluation

# Retrieve all traces from the run
traces = search_traces(run_id=run_id)

# Add custom evaluations to each trace
for trace in traces.data:
    # Example: Flag high-urgency incidents that may need manual review
    log_evaluation(trace_id=trace.id, name="combined_quality_score", value=round(combined_quality, 2))
Step 5: Explore the traces
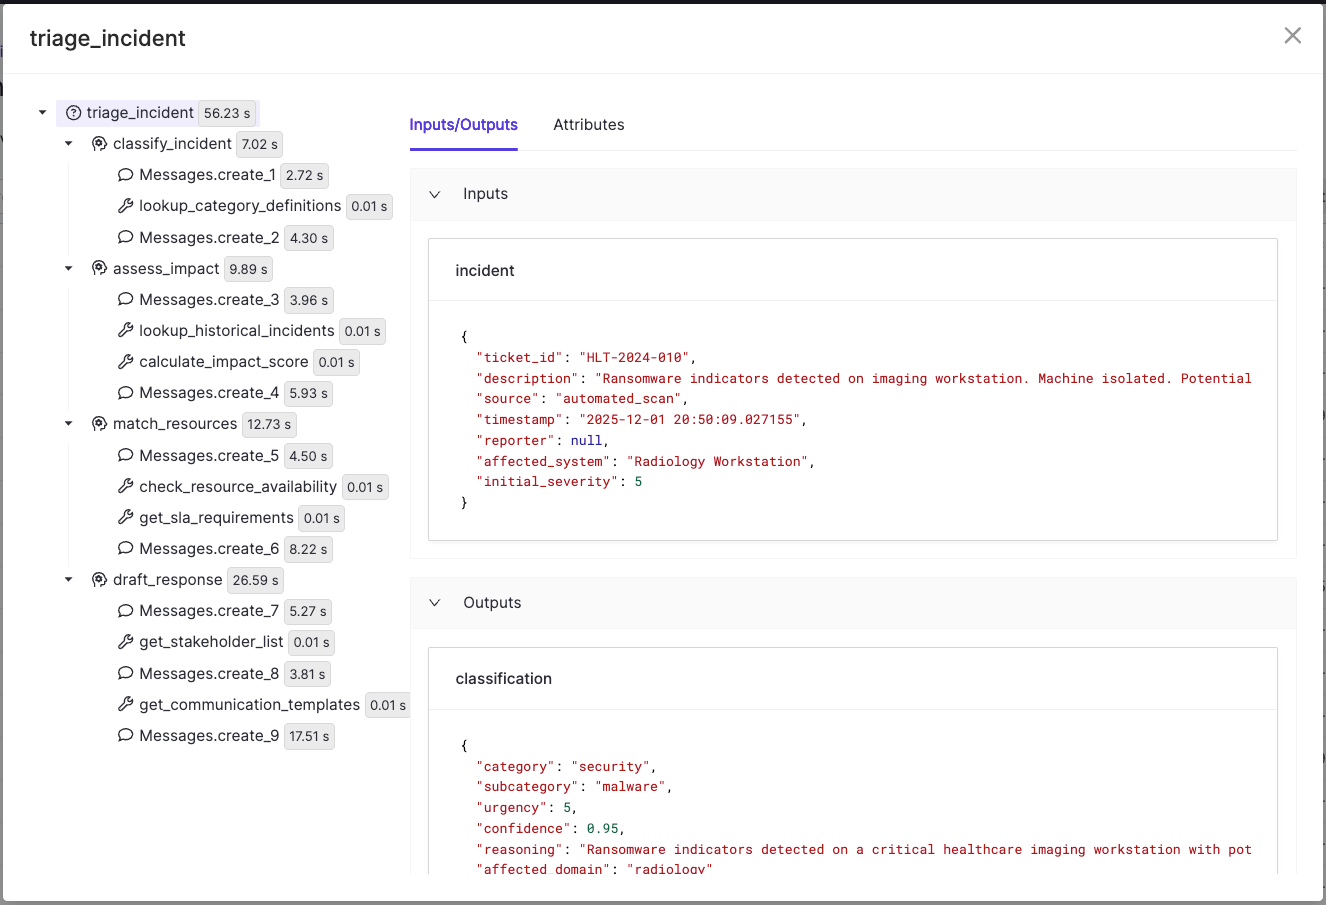
Navigate to the Experiments page in your project, select the experiment that was created under the format tracing-{user-name} and then select the run that was created. This will give you a summary of inputs to the Domino run including the hardware, run time, and data accessed. You’ll see separate tabs for Parameters, Metrics, and Traces as well. Traces should look like the following image, where you’ll see the span tree which differentiates agents, tools and messages.
Check out the GitHub repo


Andrea Lowe
Product Marketing Director, Data Science/AI/ML

Andrea Lowe, PhD is the Product Marketing Director for Data Science, AI, and ML at Domino Data Lab, where she drives go-to-market strategy and technical content for the platform. Over six years at Domino, she has worked across training, sales engineering, product, and customer success, building a deep understanding of what it actually takes to deploy AI in regulated industries. Before entering tech, she was a neuroscientist turned data scientist.