Data-driven model performance optimization: How to monitor and optimize endpoints in Domino
Author
Alex Glenn
SRE Manager East
Article topics
Model endpoint monitoring, UI dashboards, CPU/memory validation, request/response testing, production utilization checks
Intended audience
Data scientists, DevOps/MLOps engineers
Overview and goals
Domino makes it easy for data scientists to deploy endpoints, but deployment is only part of the job. Without validation, models risk being inefficient, returning incorrect results, or not being used in production at all.
This blueprint helps you:
- Validate endpoint responses during development.
- Monitor CPU, memory, and error rates as you test.
- Confirm your endpoints are actually serving traffic after deployment.
By checking these metrics early and often, you’ll avoid shipping slow, costly, or broken endpoints.
When should you consider using this approach?
- When you first deploy an endpoint and want to confirm correct behavior.
- During development, to test efficiency and optimize code before handing off.
- After deployment, to check utilization and provide evidence that your model is running correctly in production.
Why does data-driven mode performance optimization help you achieve the above goals?
- Direct validation: You see real request/response pairs to confirm correctness.
- Resource efficiency: CPU and memory charts show whether your model is consuming excessive resources.
- Production confirmation: Traffic metrics prove whether your model is actually used, preventing “silent failures” where a model is deployed but never called.
How to do model validation in Domino
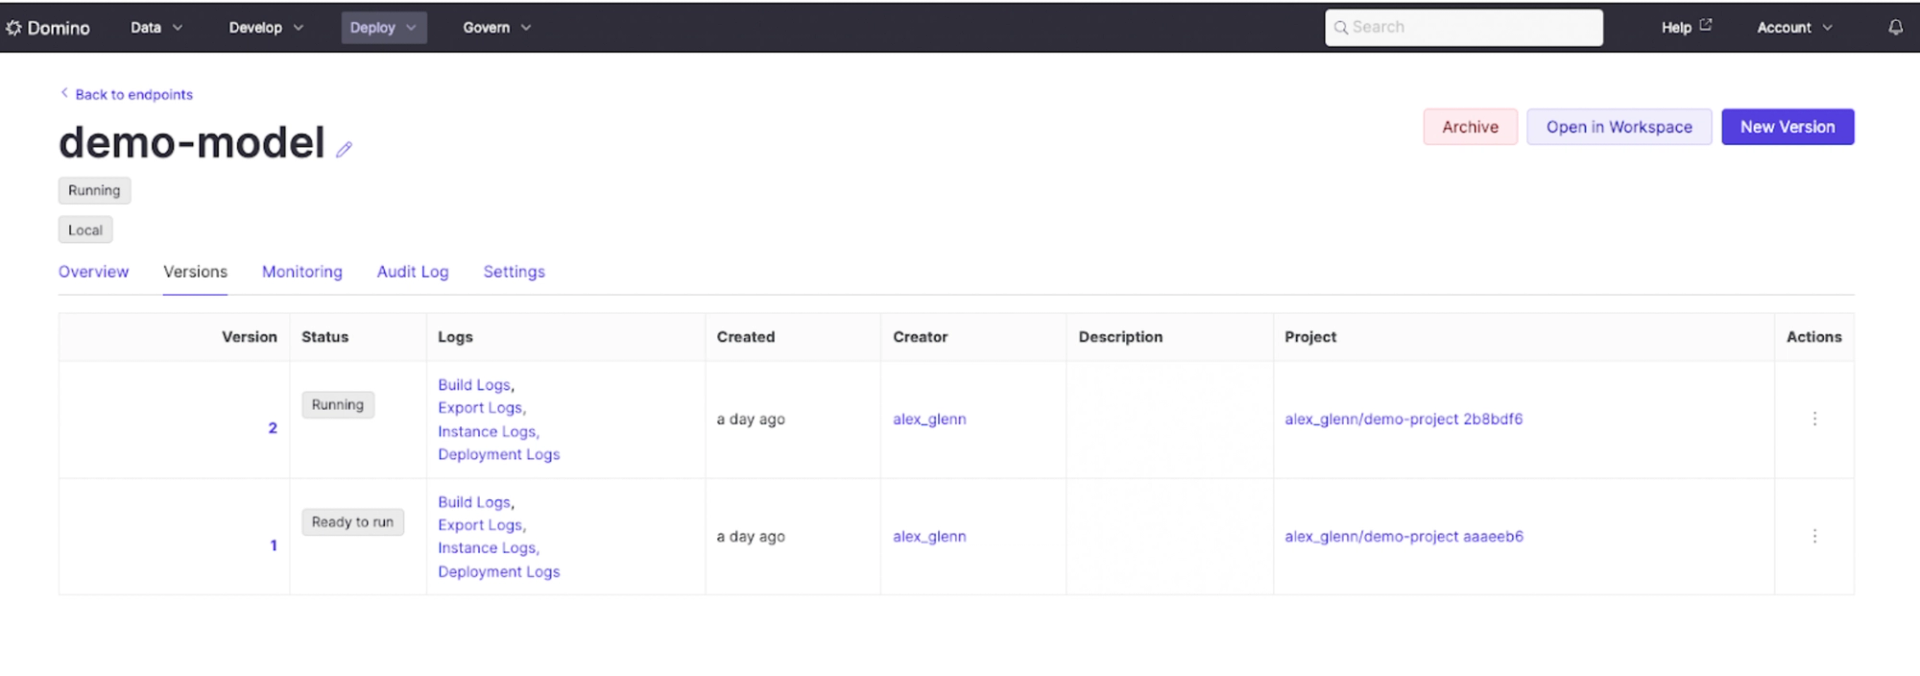
Step 1. Deploy your model endpoint and validate responses
- Navigate to Endpoints → [Your Endpoint] → Versions.
- Send a test request using the Domino UI, curl, or a Python client.
#!/usr/bin/env python3
"""
Quick Test Script for Domino Model Endpoints
Copy and paste this script to test your model and observe metrics in Domino
"""


import requests
import time


# Replace with your Domino model endpoint URL
ENDPOINT_URL = "https://your-domino-instance.com/models/your-model-id/latest/model"


# Replace with your Domino API key (same value for both username and password)
API_KEY = "your-domino-api-key-here"


def test_model():
   """Test the model endpoint and measure response time"""

   # Sample request data - adjust based on your model's expected input
   data = {
       'data': {
           'start': 10,
           'stop': 90
       }
   }

   headers = {'Content-Type': 'application/json'}

   print(f"Testing endpoint: {ENDPOINT_URL}")
   print("Sending request...")

   start_time = time.time()

   try:
       response = requests.post(
           ENDPOINT_URL,
           json=data,
           auth=(API_KEY, API_KEY),  # Domino uses API key for both username and password
           headers=headers,
           timeout=30
       )

       response_time = time.time() - start_time

       print(f"Status Code: {response.status_code}")
       print(f"Response Time: {response_time:.3f} seconds")

       if response.status_code == 200:
           result = response.json()
           print("✅ Success!")
           print(f"Response: {result}")
       else:
           print("❌ Error!")
           print(f"Error: {response.text}")

   except Exception as e:
       print(f"🔥 Connection Error: {str(e)}")


if __name__ == "__main__":
   print("🎯 Quick Domino Model Test")
   print("=" * 40)
   test_model()
print("\n💡 Check your Domino dashboard for CPU, memory, and HTTP metrics!")- Confirm the endpoint returns the expected output for known inputs.


Step 2: Monitor CPU, memory, and traffic during development
Domino provides real-time usage charts directly in the endpoint version page. These charts let you quickly spot inefficiencies and validate improvements by switching between versions:
- CPU usage: Look for consistent patterns. If one version shows noticeably higher CPU load than another, that’s a sign of inefficient code or resource pressure.
- Memory usage: Healthy models stabilize after initialization. If memory keeps climbing or fluctuates heavily across requests, you may need to revisit how your model handles data.
- Traffic metrics: Verify that your test requests are being recorded. Missing traffic usually points to wiring or deployment issues.
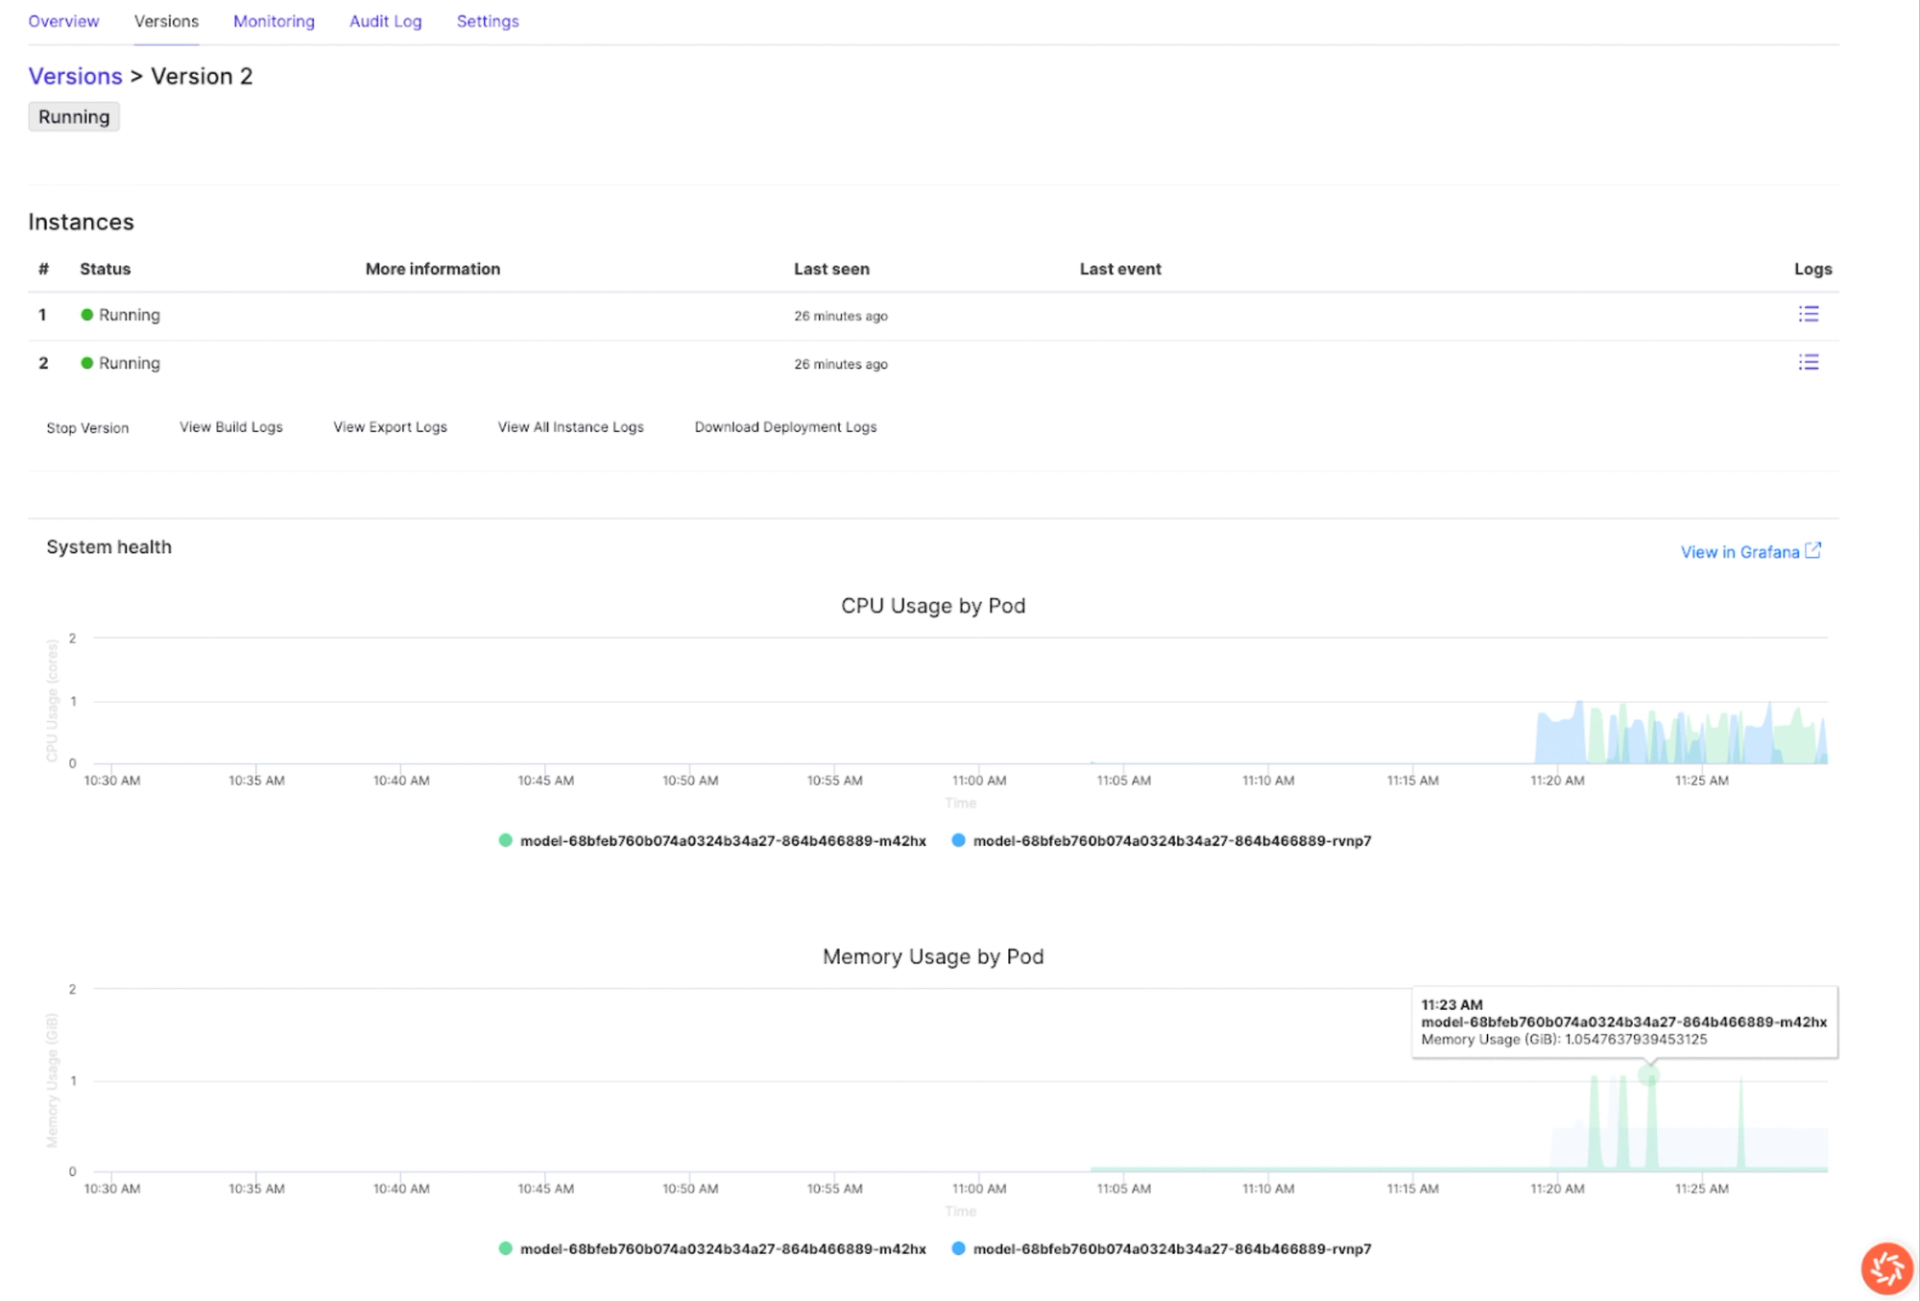

By switching between versions, you can easily confirm whether new code changes improved efficiency or introduced regressions. For example, if Version 2 shows CPU spikes or memory growth compared to Version 1 as you clearly see above, you know where to focus optimization.
Step 3: Review request success and error rates
Every request generates a status code, which gives you immediate feedback on reliability. The status code distribution panel lets you compare patterns across versions:
- 2xx = success → Confirms predictions are returned correctly.
- 4xx = client errors → Often point to input or validation issues.
- 5xx = server errors → Indicate failures inside the model or its environment.
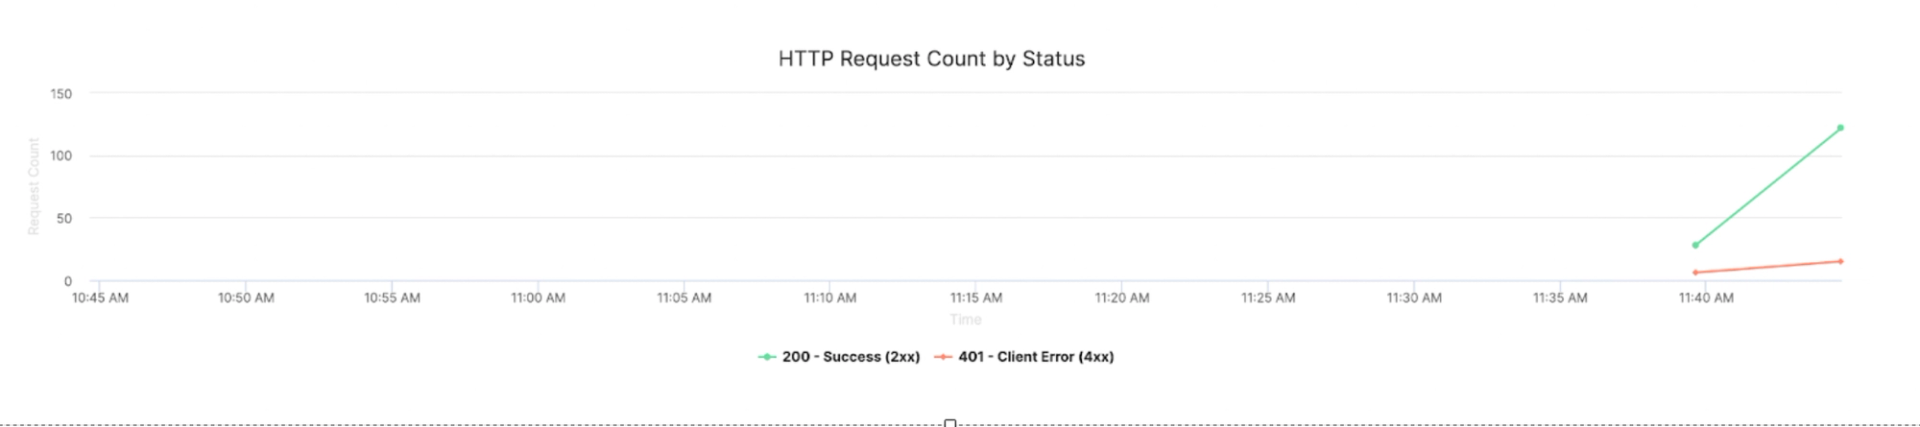

If errors increase after a new deployment, it’s a signal that the change introduced instability. If errors decrease, you’ve validated that your fix worked. This gives you confidence that the model is production-ready.
Step 4: Confirm utilization in production
Once deployed, you should validate not just correctness, but actual usage:
- Return to Endpoints → Versions.
- Check traffic volume to confirm downstream apps or users are calling the model.
- Review error rates to ensure those calls are successful.


Step 5: Collaborate with ops
If you notice anomalies (e.g., high memory usage or spikes in 5xx errors), provide ops with:
- Endpoint name and version
- Screenshot of CPU/memory/traffic metrics
- Example request/response
This shared context helps ops configure scaling, alerts, and deeper monitoring.
Work with Domino Professional Services to:
- Interpret utilization to confirm real-world adoption
- Turn latency/error data into tuning actions
- Prioritize model iterations with clear evidence
- Build a lightweight “measure → improve → validate” loop in Domino


Alex Glenn
Site Reliability Engineering Manager

Alex Glenn is an SRE/MLOps leader with a background in software development and application DevOps. He helps build the platform layer that bakes observability and reliability into the product, so enterprises can run ML models and apps with confidence. Alex turns real-world patterns into clear, practical blueprints that help teams validate models, monitor performance, and prove real usage from development through production. The goal: repeatable, evidence-based MLOps that scales across the organization.