Production monitoring for MLOps: How to ensure reliable model endpoints in Domino
Author
Alex Glenn
SRE Manager East
Article topics
Production monitoring, Grafana dashboards, latency monitoring, custom alerting, collaboration with developers
Intended audience
MLOps engineers, SREs, and platform administrators responsible for production reliability
Overview and goals
Deploying models is only half the challenge. Ops teams must ensure these endpoints remain reliable, performant, and cost-efficient in production. Unlike traditional apps, ML models introduce variability based on input size and complexity, so standard monitoring isn’t enough.
This blueprint helps ops teams:
- Monitor endpoint health and latency using Grafana dashboards.
- Collaborate with developers to diagnose and improve performance.
- Configure custom alerts for error rates, latency, and resource exhaustion.
- Use historical data for capacity planning and cost optimization.
By treating endpoints as first-class production services, you’ll reduce outages, accelerate incident response, and enforce SLAs with confidence.
When should you consider production monitoring for MLOps?
- When models are deployed in production and serving business-critical workloads.
- When SLAs or compliance require monitoring of availability, latency, and error rates.
- When debugging incidents that require coordination between ops and developers.
- When forecasting scaling and capacity requirements.
Why does this approach help achieve the above goals?
- Deeper visibility: Grafana dashboards expose latency percentiles, error codes, and resource usage.
- Actionable alerting: Ops teams can create custom alerts for issues before they impact users.
- Collaborative debugging: Shared metrics allow Ops and developers to identify code vs infrastructure issues quickly.
- Capacity insights: Long-term dashboards reveal scaling needs and optimization opportunities.
How to do production monitoring in Domino
Step 1: Access the Model Endpoints dashboards in Grafana
Ops teams have two ways to open the dashboards:
Option 1: From Admin Reports
- Go to Admin → Reports → Grafana → Dashboards → Model Endpoints.
- Filter by model_id and version to isolate the endpoint you’re monitoring.
- Save starred dashboards for quick access to critical endpoints.
Option 2: Directly from the Endpoint UI
- Navigate to Endpoints → [Your Endpoint] → Versions.
- Click the Grafana link.
- The dashboard will open with model and version filters pre-applied.


This flexibility makes it easy for both developers and ops teams to work off the same filtered view, reducing the back-and-forth needed during debugging or performance reviews.
Step 2. Monitor endpoint health and error rates
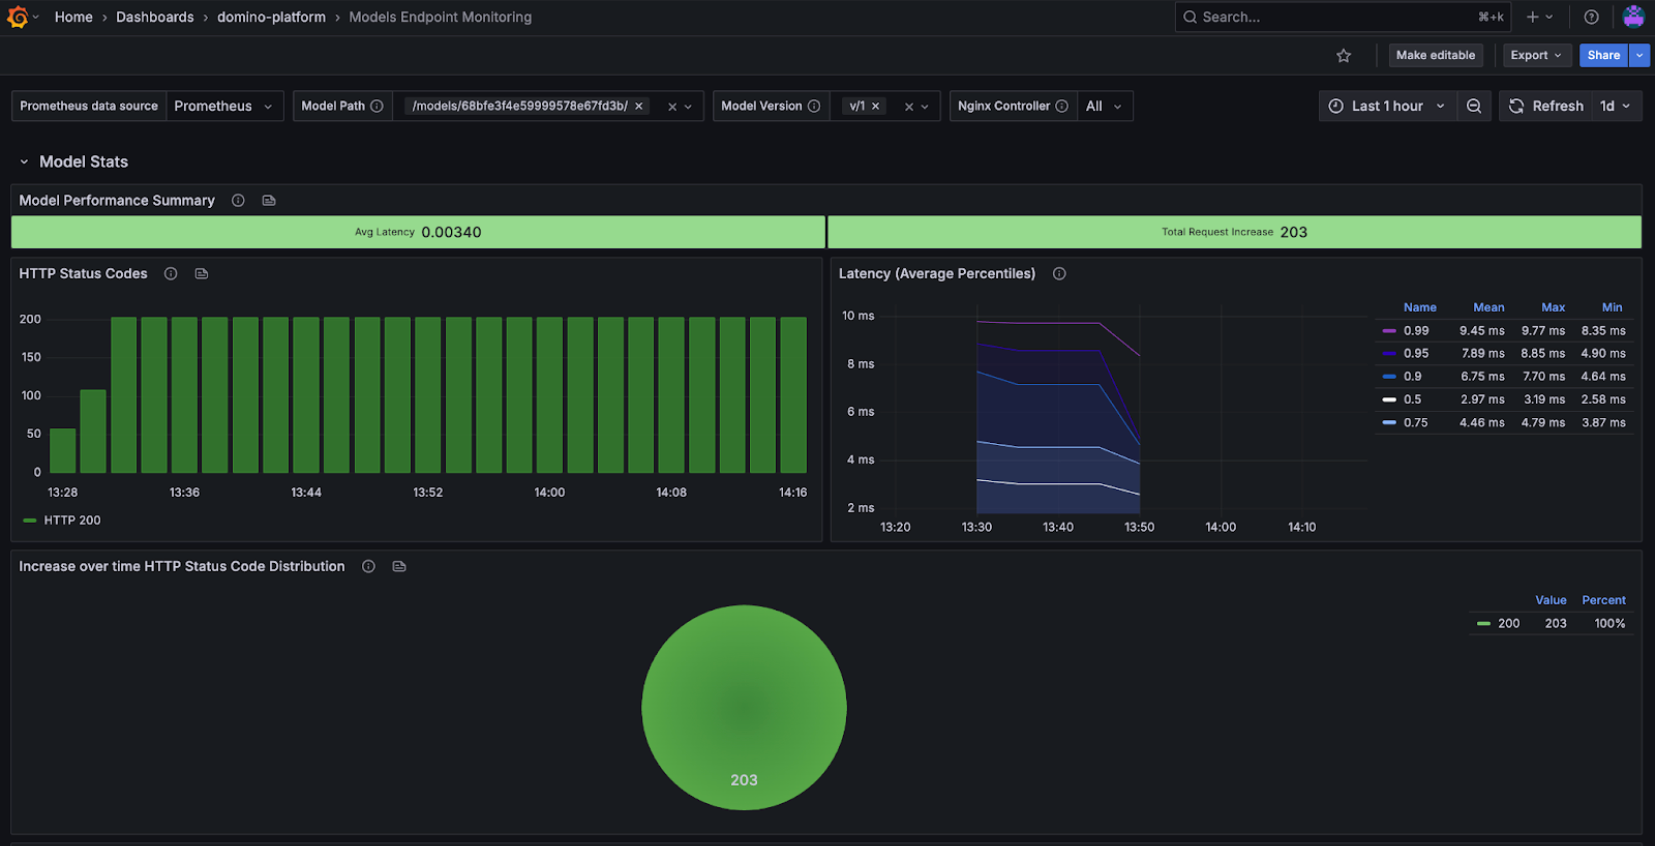
Use the Model Performance Summary and Status Codes panels:
- 2xx success codes → healthy predictions.
- 4xx client errors → likely input or auth issues (work with developers if persistent).
- 5xx server errors → infrastructure or model failures, require immediate attention.

If errors spike, collaborate with developers to test payloads and confirm whether the issue is input-related or due to the model itself.
Step 3. Track latency and response times
Latency is a key SLA measure. Domino dashboards show P50, P95, and P99 latency, percentiles which help you evaluate both typical and worst-case performance:
- P50 (median) → typical user experience.
- P95/P99 (tail latencies) → worst-case scenarios, critical for SLAs.
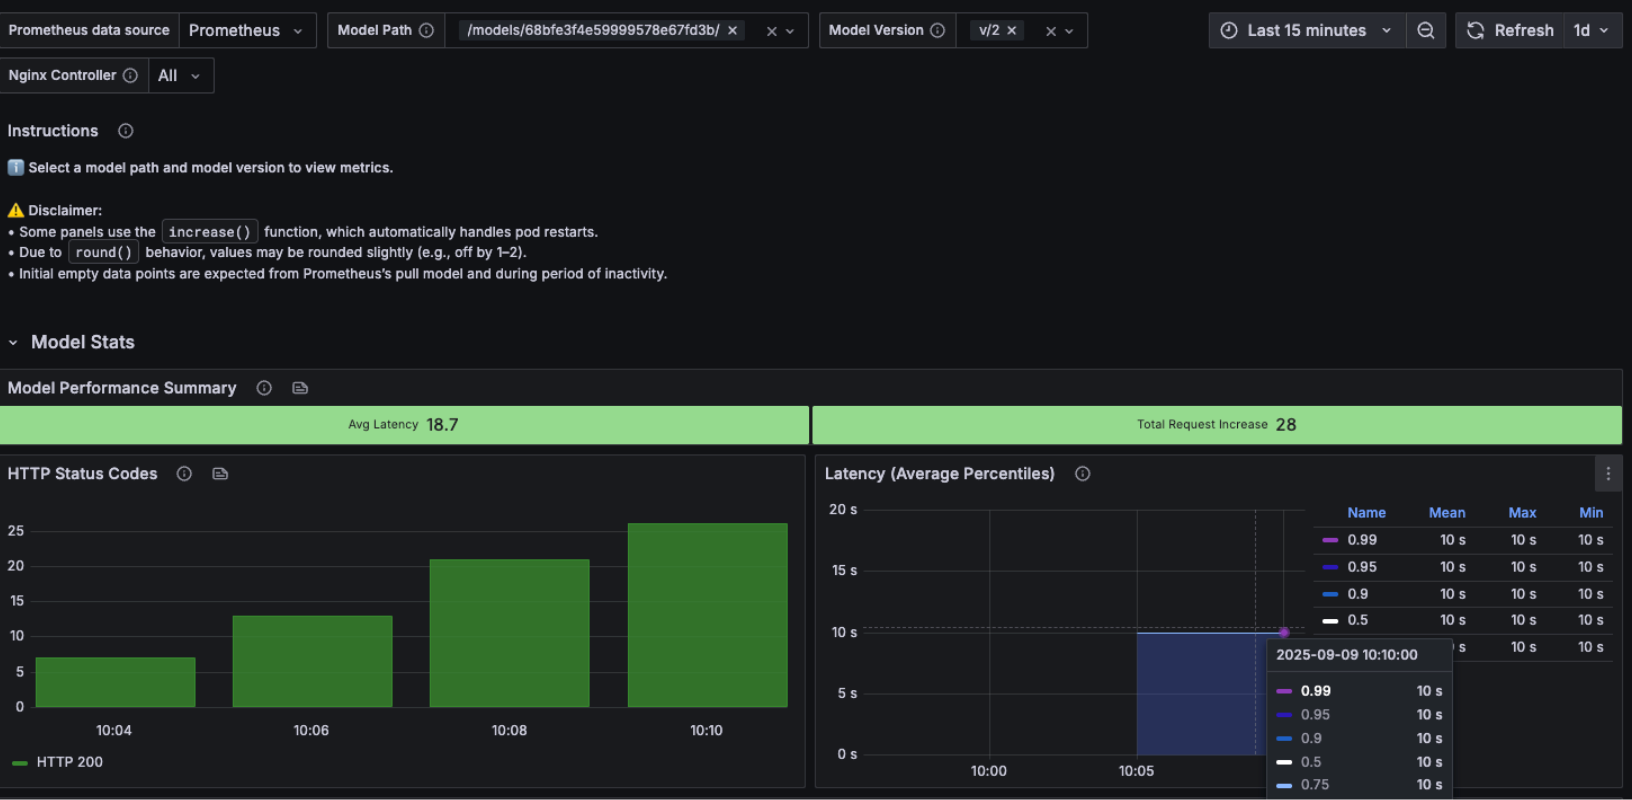

We can again use versioning and testing to see whether latency issues are introduced by code changes or driven by external infrastructure factors. For example, comparing Version 1 (good latency) with Version 2 (bad latency) clearly shows that the degradation came from code in the new version rather than from the serving environment.
This makes it easier for ops and developers to align: ops can confirm the infra is stable, while developers know they need to investigate recent code changes.
Step 4. Create custom alerts in Grafana
Ops teams can proactively monitor endpoints by creating Grafana alerts. Common examples:
- High-error rate: 5xx errors above normal baseline.
- Latency degradation: P95 or P99 latency exceeds expected thresholds.
- Resource exhaustion: Sustained high CPU or memory growth.
PromQL example (error rate alert):
100 * (sum(increase(nginx_ingress_controller_requests{status=~"400|402|403|404|405|406|408|429|5..", path=~"/models/68bfe3f4e59999578e67fd3b/v/1.*"}[$__range])) / sum(increase(nginx_ingress_controller_requests{path=~"/models/68bfe3f4e59999578e67fd3b/v/1.*"}[$__range])))
We can create alerts directly from the panels. This way, they will link us back to the dashboard when triggered.

This alert lets ops detect issues quickly and escalate to the right team. You can easily test it by sending requests that trigger errors and watching the alert fire. Domino created an alert if the success rate for model hits is below 80% returning a fired alert if 20% or more model hits return an invalid success code.
Step 5. Collaborate with developers on latency improvements
When latency or errors rise:
- Share Grafana panels showing P50/P95/P99 latency trends.
- Correlate spikes with code changes or new versions.
- Work with developers to test payloads and optimize code paths.
Example workflow:
- Ops notices rising P95 latency.
- Developers profile the model, implement batching/caching.
- Ops confirms improvement in Grafana after redeploy.
Work with Domino Professional Services to:
- Define SLOs for latency/success and wire alerts to your on-call.
- Build version-aware dashboards for faster triage.
- Establish capacity planning and right-size compute for models.
- Create a “detect → improve → validate” loop between ops and devs.


Alex Glenn
Site Reliability Engineering Manager

Alex Glenn is an SRE/MLOps leader with a background in software development and application DevOps. He helps build the platform layer that bakes observability and reliability into the product, so enterprises can run ML models and apps with confidence. Alex turns real-world patterns into clear, practical blueprints that help teams validate models, monitor performance, and prove real usage from development through production. The goal: repeatable, evidence-based MLOps that scales across the organization.