Interactive dashboards with knitr and htmlwidgets
Nick Elprin2015-01-19 | 3 min read

Introduction
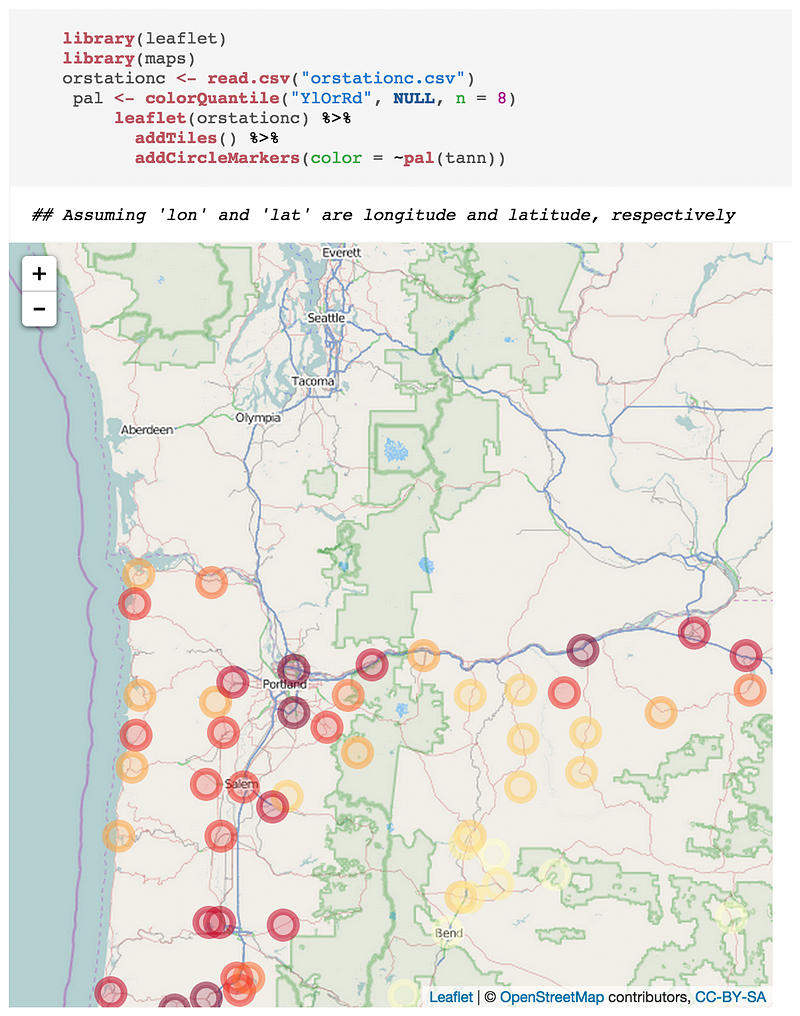
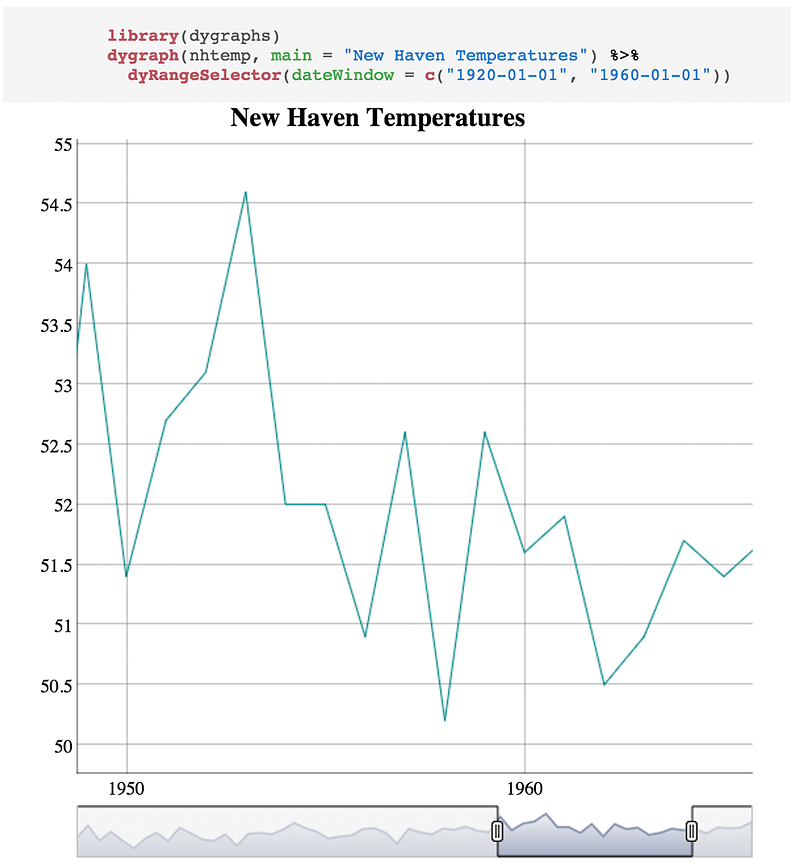
htmlwidgets for R is a nifty R package that lets you easily generate interactive visualization. There are already widgets for interactive time series charts, 3D plots, maps, and network graphs.
For those who don’t know, Domino is a platform for running, sharing, and deploying analytical models (in R, Python, or other languages). Among other things, Domino lets you run your code on powerful machines, and will store your results so you can share them with others.
Because Domino will store any results your code generates when it runs (images, HTML files, etc), and htmlwidgets can be embedded in HTML files, we can run R code on Domino to generate fully hosted, interactive dashboards, like a network graph or time series chart.
This means your dashboards can now be driven directly from your code, and calculation and visualization happen in the same place.
Visualizing Calculated Results rather than Raw Data
As companies use more sophisticated data science for their internal analytics, they are finding that traditional business intelligence tools are insufficient for their visualization needs. These traditional tools are designed around the assumption that you want to visualize existing data in your database, rather than visualizing the results of calculations from your model. Domino addresses this problem by combining code execution with results visualization.
Domino's approach to visualization is simply to render any files that your code produces, whether they’re PNGs, PDFs, or entire HTML files. This flexibility makes it incredibly easy to generate rich visualization from your code. For the examples below, we simply used knitr to knit some R code that makes use of the htmlwidget sample code. The result of each different Run in Domino is a different HTML file, which Domino knows how to display as an interactive dashboard.


Implementation details
We only ran into one small issue getting these working. When you use an htmlwidget from an interactive R session, it will generate a self-contained HTML page that includes all the necessary JS files to render the widget. But when you knit an HTML file that renders an htmlwidget, you have to explicitly include the supporting JS/CSS files in your HTML. E.g., for a dygraph widget
prettyprint lang-html Just include the lib directory and its contents in your Domino project folder, and everything works perfectly.
Conclusion
htmlwidgets will be a powerful weapon in a data scientist’s arsenal, especially when it comes to sharing work with non-technical stakeholders. Combining htmlwidgets with tools like knitr and Domino, you can easily turn your R code into hosted, interactive dashboards and solve complex analytical use cases which would be impossible with simpler business intelligence tools and techniques.
Nick Elprin is the CEO and co-founder of Domino Data Lab, provider of the open data science platform that powers model-driven enterprises such as Allstate, Bristol Myers Squibb, Dell and Lockheed Martin. Before starting Domino, Nick built tools for quantitative researchers at Bridgewater, one of the world's largest hedge funds. He has over a decade of experience working with data scientists at advanced enterprises. He holds a BA and MS in computer science from Harvard.


