Visualizing home ownership with small multiples and R


The "small multiples" visualization technique was introduced by Edward Tufte, one of the current gurus of data visualization. In Envisioning Information, he wrote
At the heart of quantitative reasoning is a single question: Compared to what? Small multiple designs, multivariate and data bountiful, answer directly by visually enforcing comparisons of changes, of the differences among objects, of the scope of alternatives. For a wide range of problems in data presentation, small multiples are the best design solution.
The idea of small multiples is simple: instead of showing one complex chart with many data series, show many smaller plots side by side. This makes it much easier to quickly absorb the information comparatively. Small multiples work very well to represent data over time. Finding differences and peculiarities is easy.
Here is a visualization of home ownership rates in different states over time:
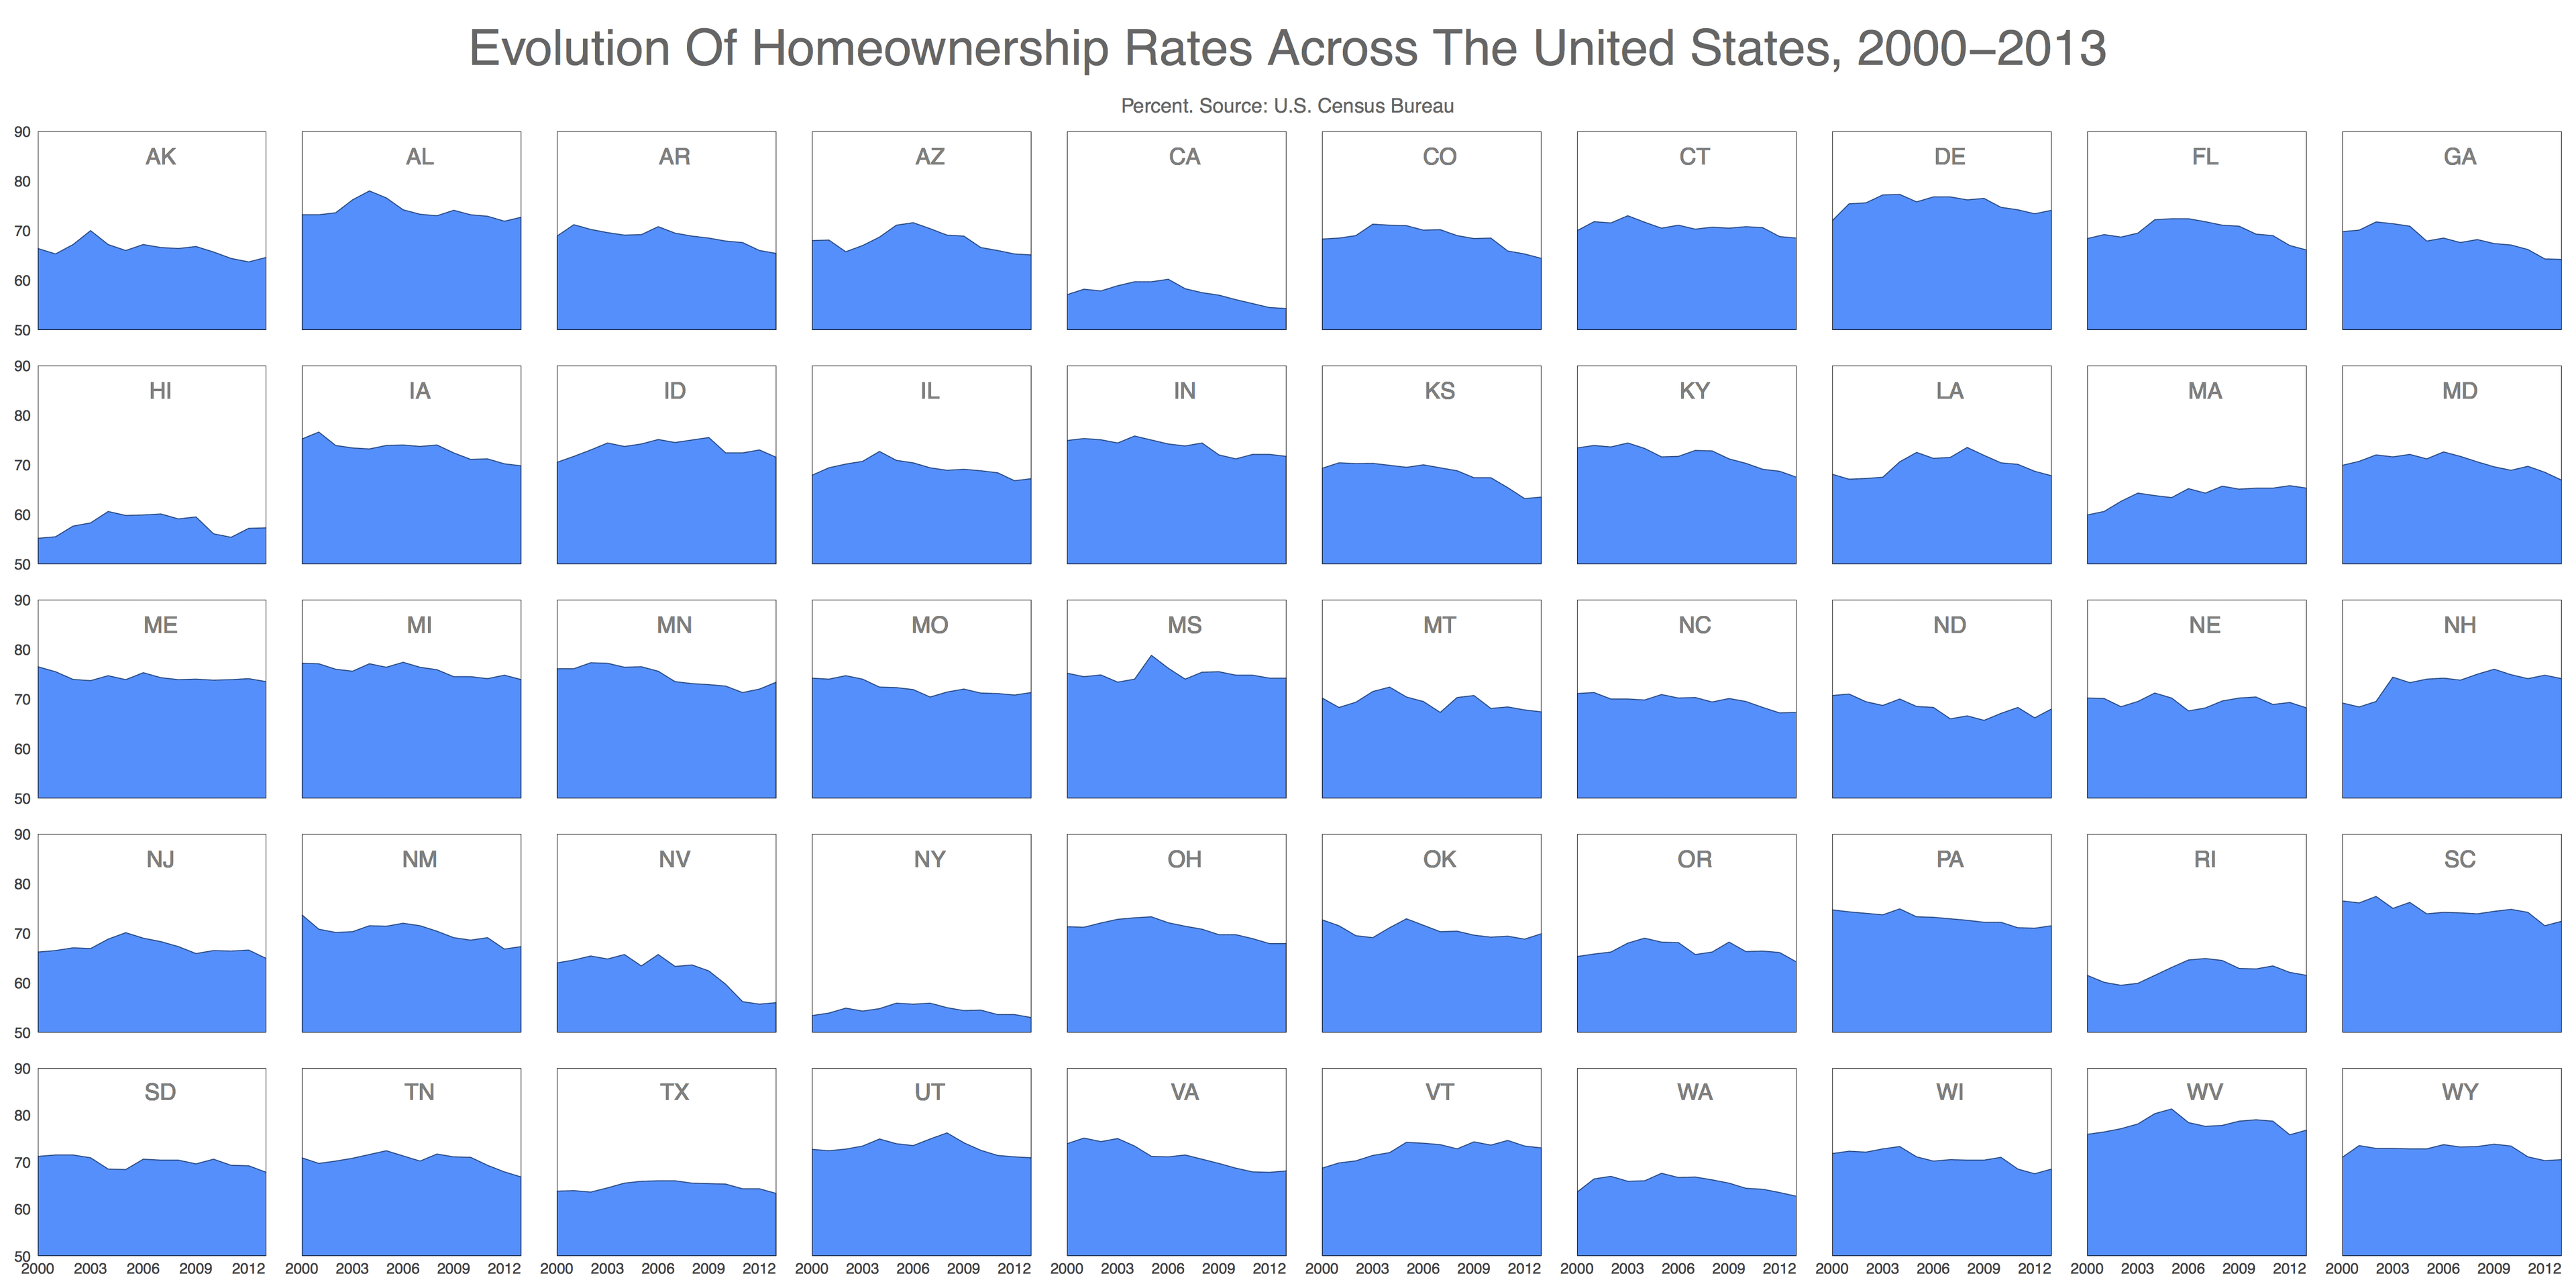
Even without being a real estate expert or economist, it is easy to notice several facts at a glance:
- New York, California and Hawaii have very low homeownership rates. On the other side Delaware, Alabama, Michigan and West Virginia have very high rates.
- Idaho, Delaware, Wyoming, Nevada have been severely beaten up by economic crisis while Massachusetts, Vermont and Maine have been fairly resistant (at least in terms of home ownership)
- In general, the homeownership rate has been decreasing
Implementation in R
R is a very powerful tool for data visualization and ggplot2 is the most useful and versatile package to make graphs (and also one of the most downloaded from CRAN). Sometimes ggplot2 is a bit hard to use, but one nice benefit of small multiples is that by definition it calls for relatively simple plots. To arrange plots I use gridExtra package, which makes easy to define the grid in which I will place the plots.
Here is the code:
install.packages('openxlsx')
install.packages('sqldf')
install.packages('gridExtra')library("openxlsx")
library("ggplot2")
library("sqldf")
library("gridExtra")# data from: http://www.stats.indiana.edu/sip/statesInProfile_dataExtract.xlsx
file = "statesInProfile_dataExtract.xlsx"data=read.xlsx(file, sheet = 33, startRow = 1, colNames = TRUE)
data[c("year", "data")]=lapply(data[c("year", "data")], as.numeric)
data=sqldf("SELECT stabb, year, avg(data) as data FROM data WHERE title='Homeownership Rate' AND stabb NOT IN ('US', 'DC') GROUP BY 1, 2")opts=theme(
panel.background = element_rect(fill="white"),
panel.border = element_rect(colour="black", fill=NA),
axis.line = element_blank(),
axis.ticks = element_blank(),
panel.grid.major = element_blank(),
panel.grid.minor = element_blank(),
axis.text = element_text(colour="gray25", size=15),
axis.title = element_blank(),
text = element_text(size=20),
legend.key = element_blank(),
legend.position = "none",
legend.background = element_blank(),
plot.title = element_text(size = 45))stabbs=unique(data$stabb)vplayout=function(x, y) viewport(layout.pos.row = x, layout.pos.col = y)
grid.newpage()
pdf(file="home_ownership.pdf",width=36,height=18)
pushViewport(viewport(layout = grid.layout(7, 10, heights=c(.4,.1,rep(1,5)), widths=c(1.1, rep(1,9)))))grid.text("Evolution Of Homeownership Rates Across The United States, 2000-2013", gp=gpar(fontsize=50, col="gray40"), vp = viewport(layout.pos.row = 1, layout.pos.col = 1:10))
grid.text("Percent. Source: U.S. Census Bureau", gp=gpar(fontsize=20, col="gray40"), vp = viewport(layout.pos.row = 2, layout.pos.col = 1:10))for (i in 1:length(stabbs))
{
datap=subset(data, stabb==stabbs[i])
p=ggplot(datap, aes(year, data, group = stabb, fill=stabb))+
geom_ribbon(aes(ymin=50, ymax=data), fill= "dodgerblue", colour = "dodgerblue4")+
geom_text(data = NULL, x = 2007, y = 85, label = stabbs[i], size = 8, colour = "gray50")+
scale_y_continuous(expand = c(0, 0), limits=c(50,90))+
scale_x_continuous(expand = c(0, 0), breaks = seq(2000,2013, by=3))+
opts
if (i%%10!=1) p=p+theme(axis.text.y = element_blank())
if (i<=40) p=p+theme(axis.text.x = element_blank())
print(p, vp = vplayout(floor((i-1)/10)+3, i%%10+(i%%10==0)*10))
}
dev.off()Implementation notes
- openxlsx package works very well to read large Excel files
- sqldf package makes it easy to transform dataframes using SQL
- I download data from STATsIndiana