Data Science at Instacart: Making On-Demand Profitable
Grigoriy2017-03-21 | 42 min read
In this Data Science Popup session, Jeremy Stanley, VP of Data Science at Instacart, gives an inside look at how Instacart uses data science to maximize profits.
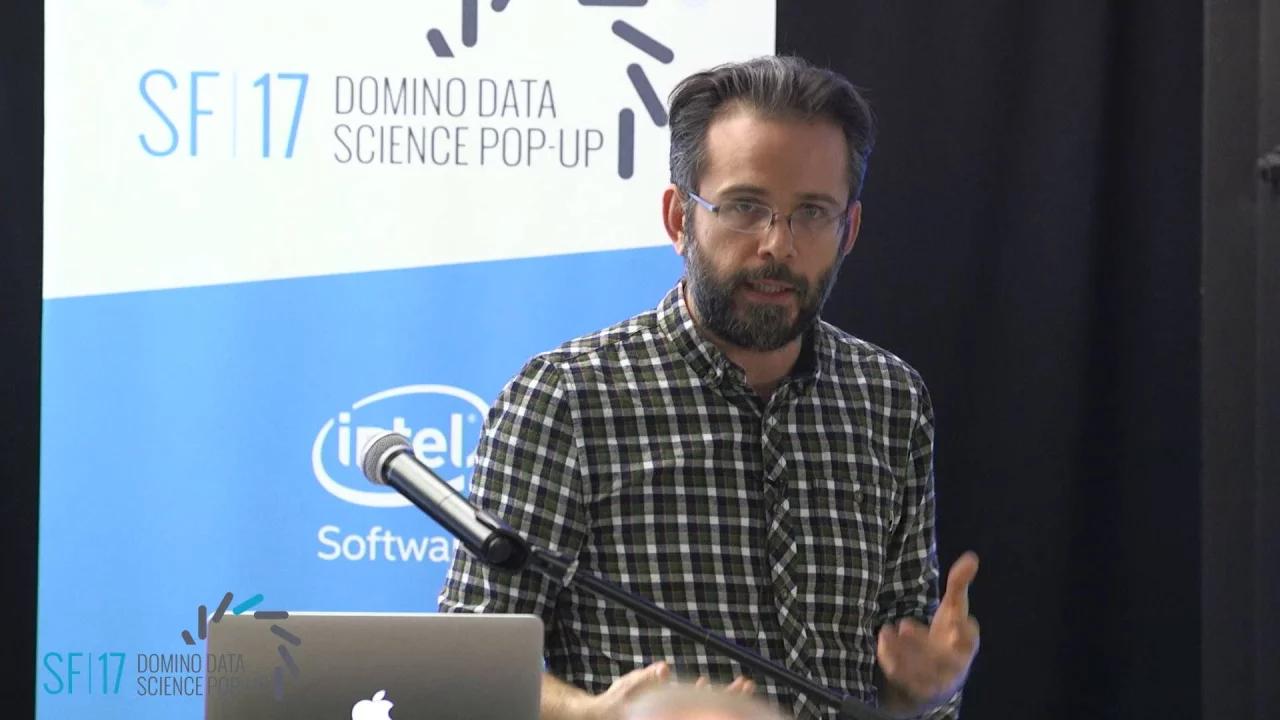
36:51
Video Transcript
Hey, everybody. I'm Jeremy Stanley. I am the head of data science at Instacart. I'm going to talk here today about some of the ways that we're using data science at Instacart to help make this on-demand economy profitable.
I'll take you through:
- A little bit about our business.
- Some of the challenges we try to solve with data science, and the logistics side of our business.
- A little bit about how we organize.
- And happy to take questions at the end.
First maybe a show of hands, how many folks here use Instacart today? ... Roughly half.
My goal is actually to get the other half of you to try Instacart. And then to get all of you to apply to work at Instacart. So if I can do those two things, then mission accomplished.
About Instacart
What is Instacart? Our value proposition is really pretty straightforward: We deliver groceries from stores you already know and love right to your doorstep in as little as an hour. It's really that simple.
I think it helps to look at what you experience as a customer. If you haven't used Instacart before, this is what you would go through:
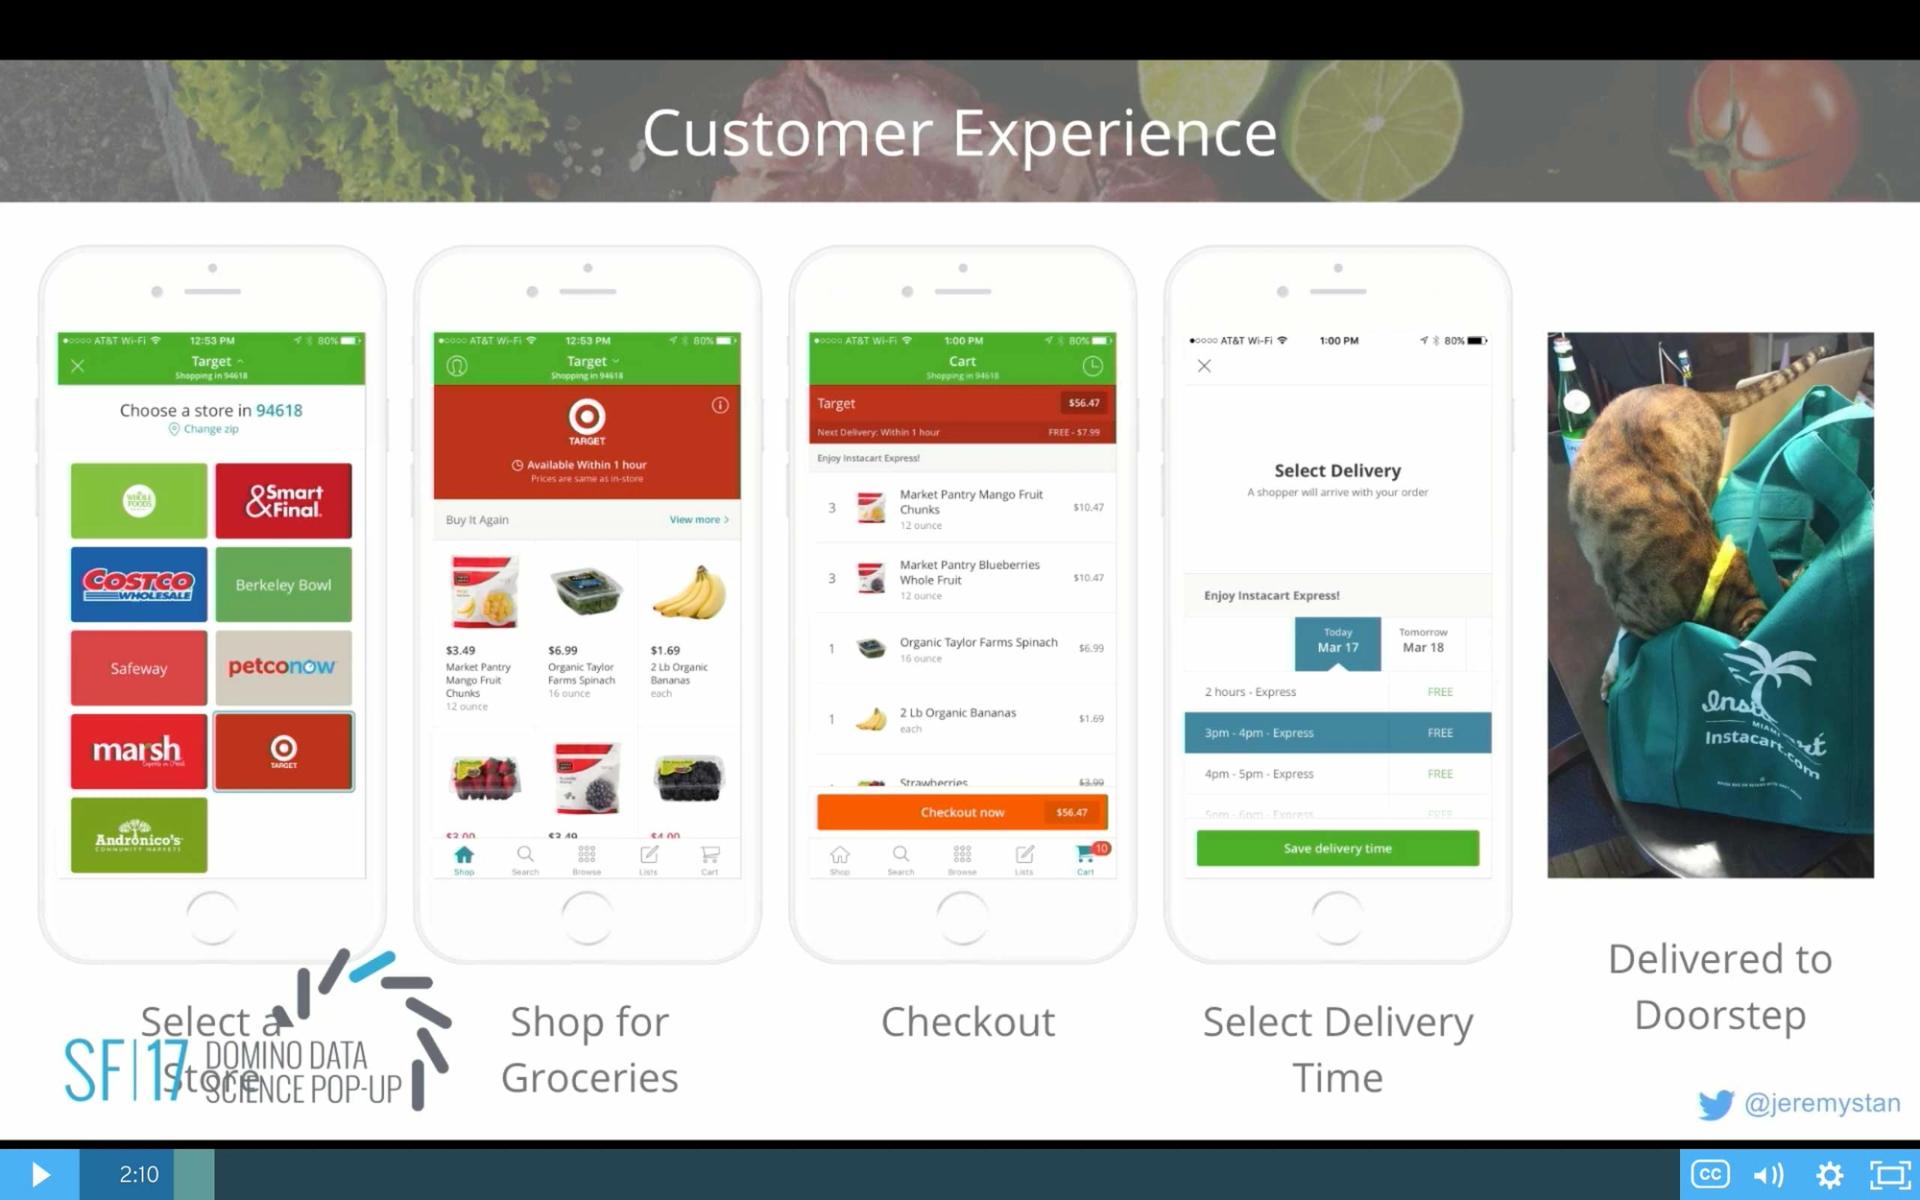
- You would start off by downloading the application.
- You would see a store chooser. You would look at a bunch of different stores like Whole Foods or Costco or Berkeley Bowl if you live in the East Bay, Andronico's, etc. And you would choose one of those stores.
- You'd be exposed to all of the inventory that that store has at the location nearby you. And you would start to search, looking for the products that you already know and love, adding them to your cart.
- Eventually you would have a basket full of groceries. You would check out. And you would select a delivery time. That delivery time could be within the next hour. Or it could be in two hours or some one hour window scheduled into the future.
- Once you've selected that delivery time, eventually we would let you know that the groceries were on their way. And someone would come to your house and drop off the groceries.
- You would take the bags that they come in and take all the groceries out and put them in your pantry. And then you would let your pet crawl into the bag. And you take a picture of your pet in the bag. And you put that on Twitter. And then you become famous.
That's actually the whole experience. You've got to have the pet in the bag and the photo on Twitter to use the product. Otherwise you're not doing it right.
What you may not appreciate is that this is a fairly simple customer experience, not that different on the web as it is in mobile, though a lot of complexity behind the scenes.
We have an app dedicated to our shoppers that is even more complex than the app you would use as a customer.
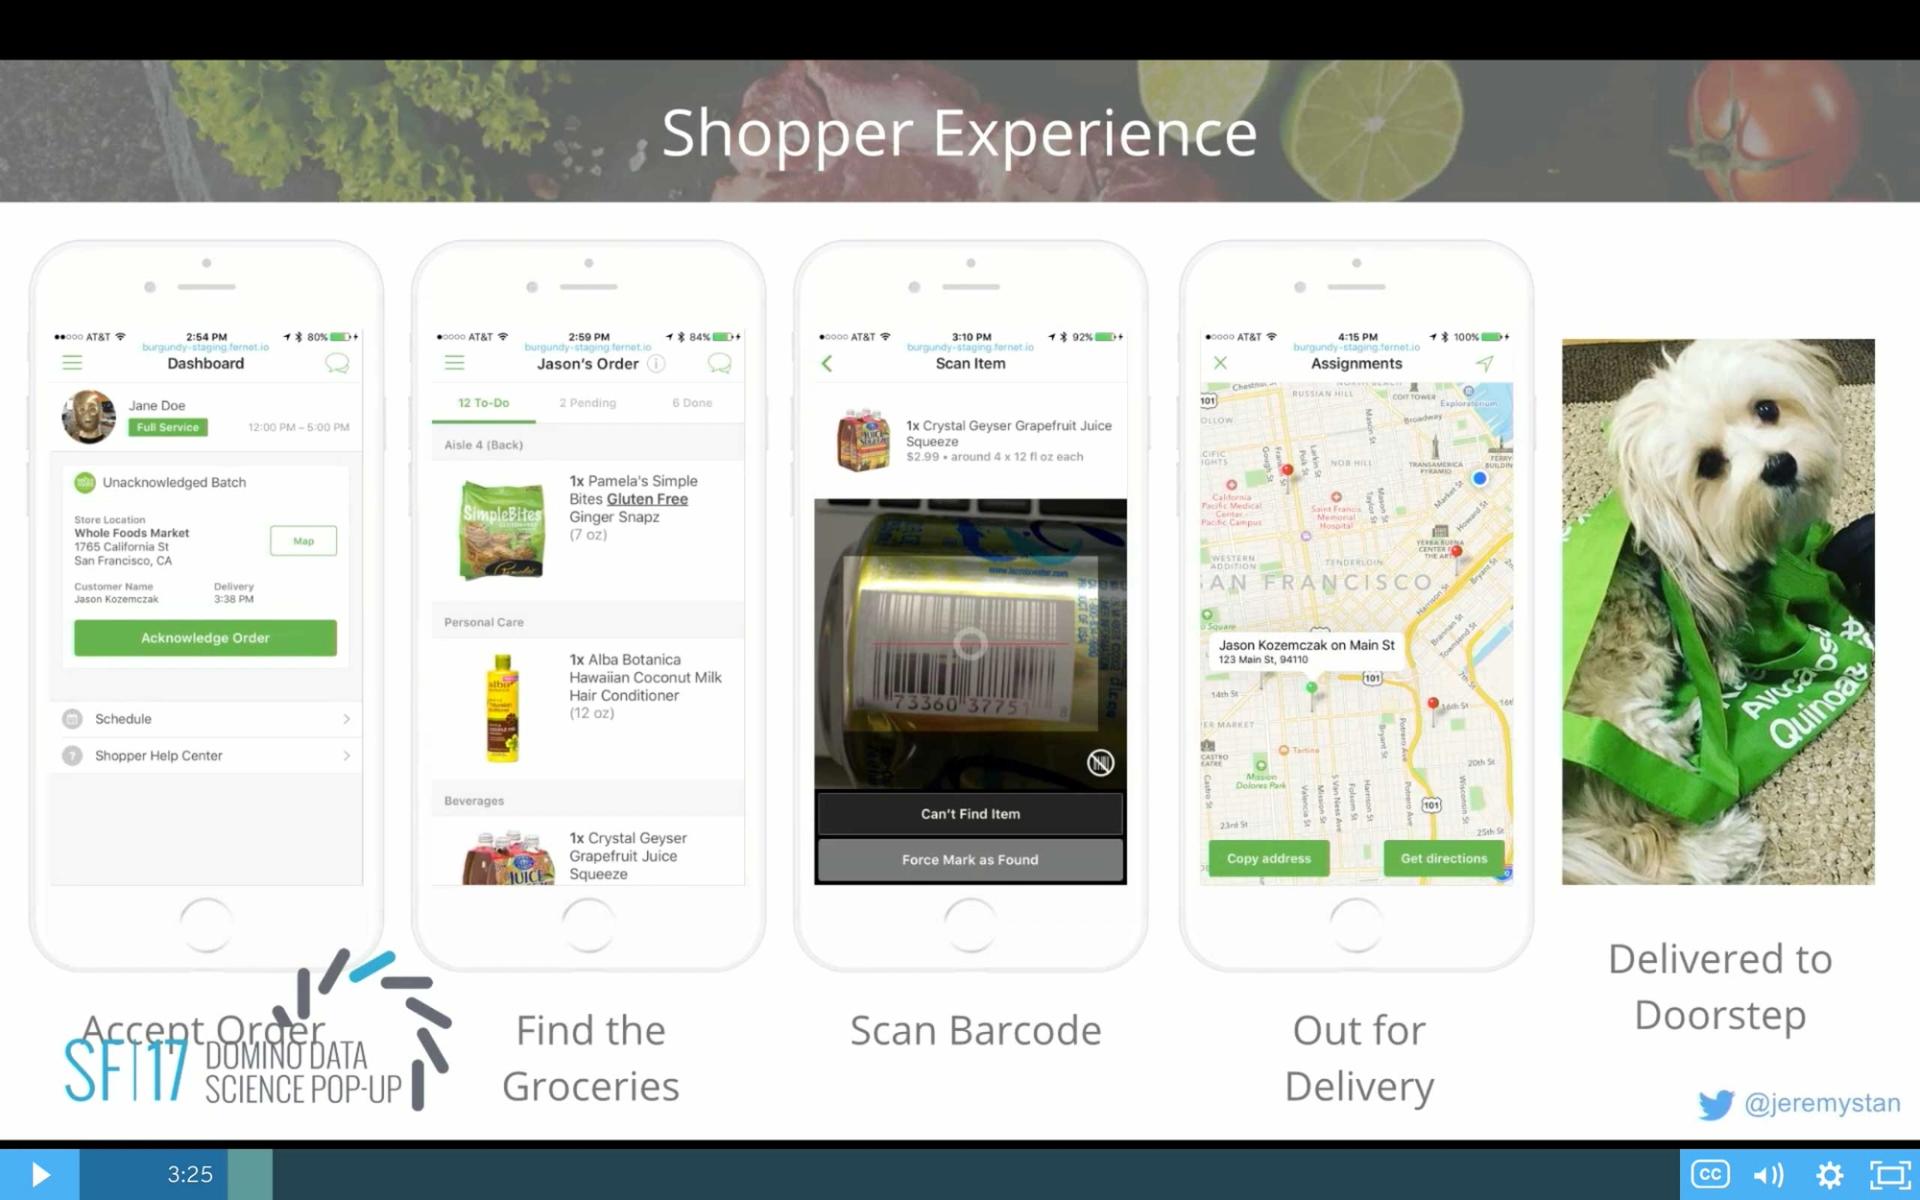
In that app, a shopper is on shift. They're given the opportunity to fulfill an order. Maybe it's the order for you. And so they go into the app, and they acknowledge that order. They would drive to the store. And they'd be presented with a list of all of the items that you'd like to have. They would start to navigate through the store. And as they found items, they'd pick them up. And they would scan the barcode to make sure they got you the exact flavor of nonfat Greek yogurt that you wanted. They'd then check out and get back into their car and go out for delivery to drive to your address. And then the whole pet in the bag thing, that happens again but with a different pet maybe.
What I really want to talk to today is some of what we do on the back end to help facilitate this and to make it efficient. To do that, I want you to better understand our business and how it is that we make money and what some of the challenges are.
I've already talked about two sides in the Instacart marketplace. It's actually a four-sided marketplace, but the two that are most obvious are the customers on one side and the shoppers on the others. The shoppers are doing delivery. There's a customer service relationship back and forth between the shopper and the customer. Maybe they're out of stock at the grocery store for the exact brand of yogurt that you want.
But there's also the stores themselves. They are another critical part of our four-sided ecosystem. The shoppers are going to those stores and shopping in those stores. Maybe we can automate checkout. Maybe we can get better data about item availability or how we route the shoppers in the store. Customers have a lot of loyalty for the stores. Which store should we present to what customer when they show up at the site? And the stores have all the inventory that they're making available to the customer to search and buy groceries. So a bunch of interesting relationships there.
Then there's the fourth side, which are the products themselves, and the advertisers that make many of those products—the consumer packaged goods companies. The shoppers are picking those items off of shelves in stores. And the customers are searching for the items. And the items are searching for the customers through advertising.
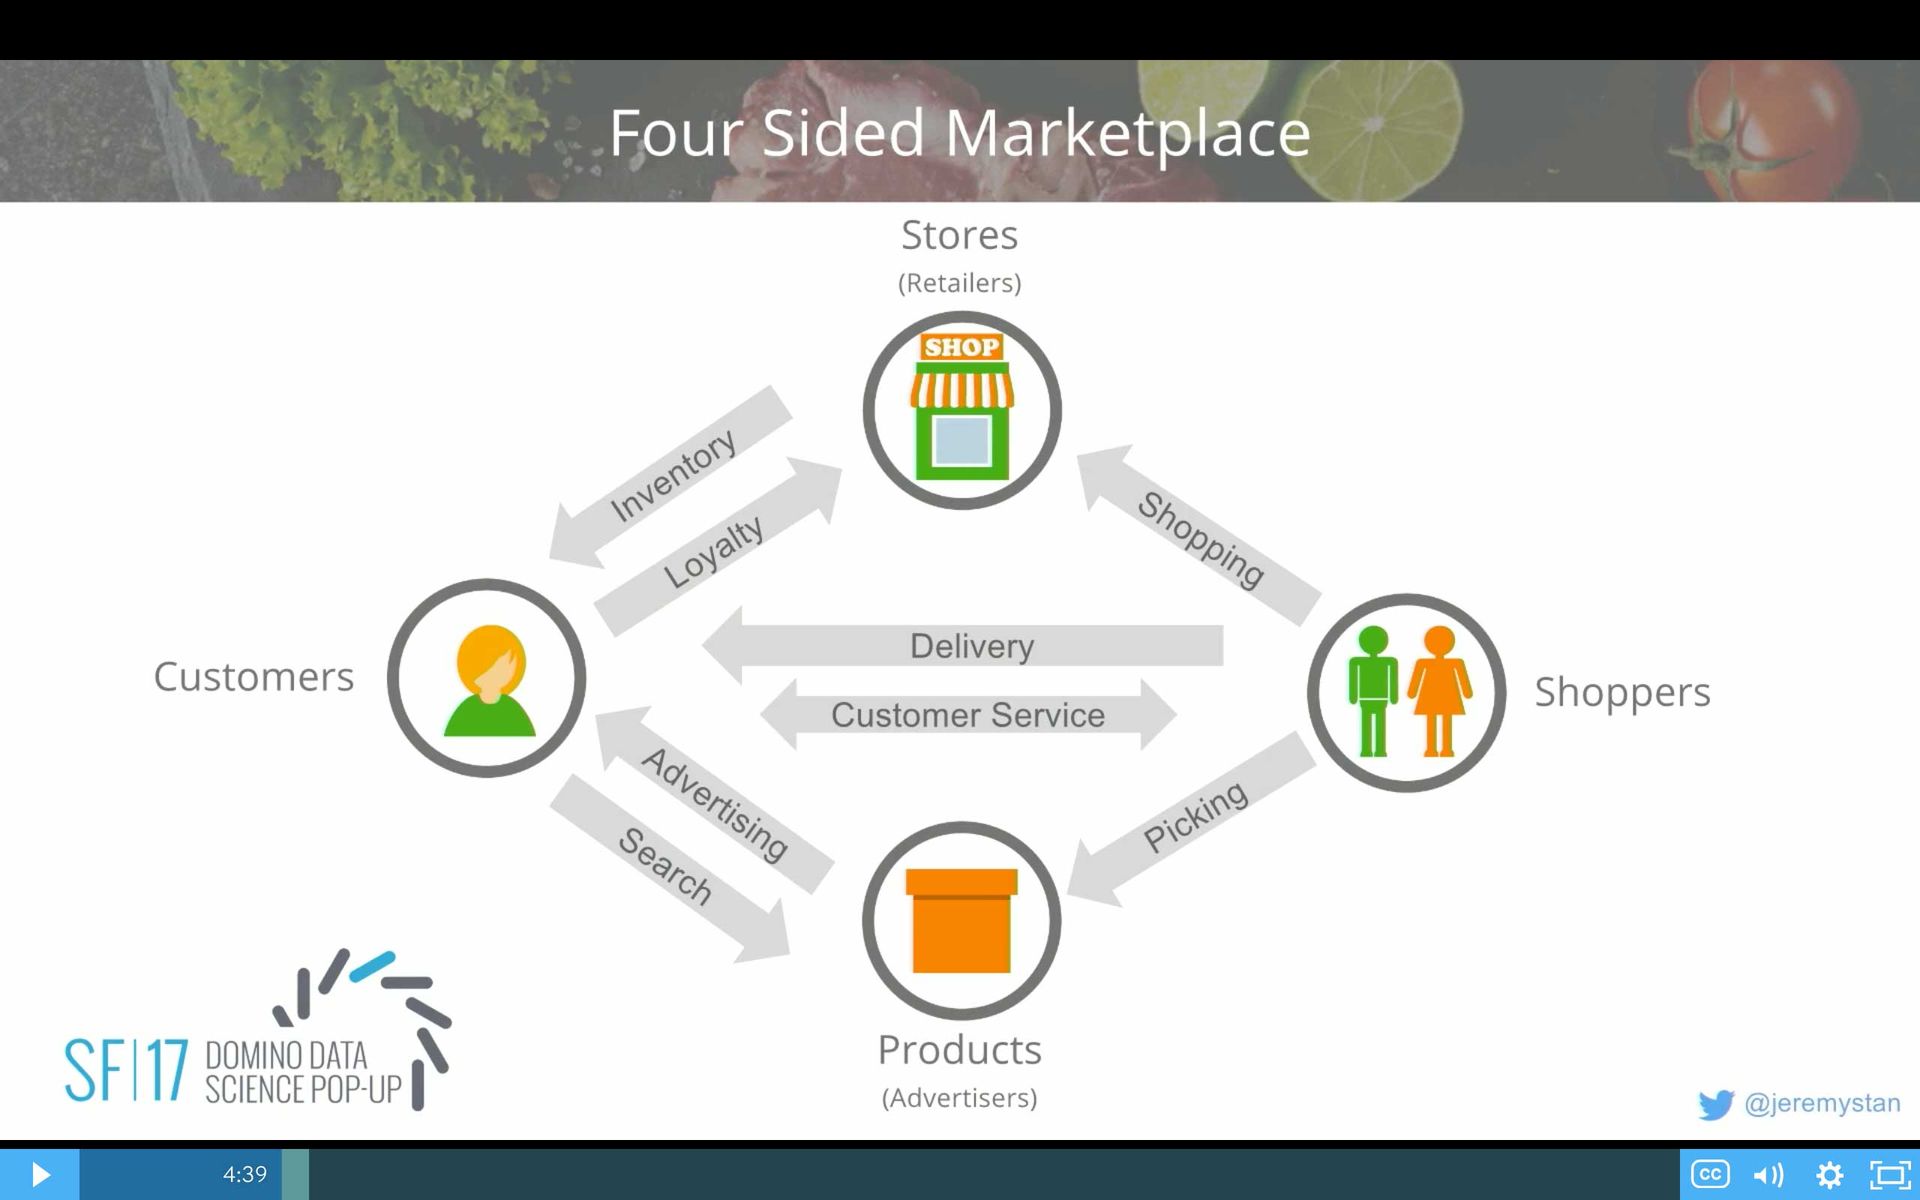
One of the interesting things is every one of these arrows at Instacart is a big opportunity for the application of data science. We're collecting data about multiple parties in this ecosystem interacting. And there're opportunities for us to influence that to drive your better outcomes for all four parties.
One question you might have: Delivery of groceries in an hour sounds really tough. There was this company that tried to do this kind of thing in the past. They didn't work out so well. They were called Web Van. Can Instacart succeed?
In order for us to do that, we really need three things:
- The first one is a really large market. Check, we've got that. Groceries in the US is a $600 billion market. That's literally just groceries in the United States.
- The second is, can we create a product that customers really love? And I think we've done that well. Customers do really love the product. It's a tremendous time savings for people. You can oftentimes order your groceries in as little as a minute or two once you've used the app a few times. So customers love us.
- But can we make money? Can we generate unit economics? Can we make more money on every delivery than it costs us? Or do we go the way of Web Van with a large market and a lot of happy customers but not enough funding?
In order to understand that, you have to think about what are our unit economics. I think that this is a little bit surprising. From the outside, you might think about it one way, but once you realize what's happening in those four sides, it's a little bit different.
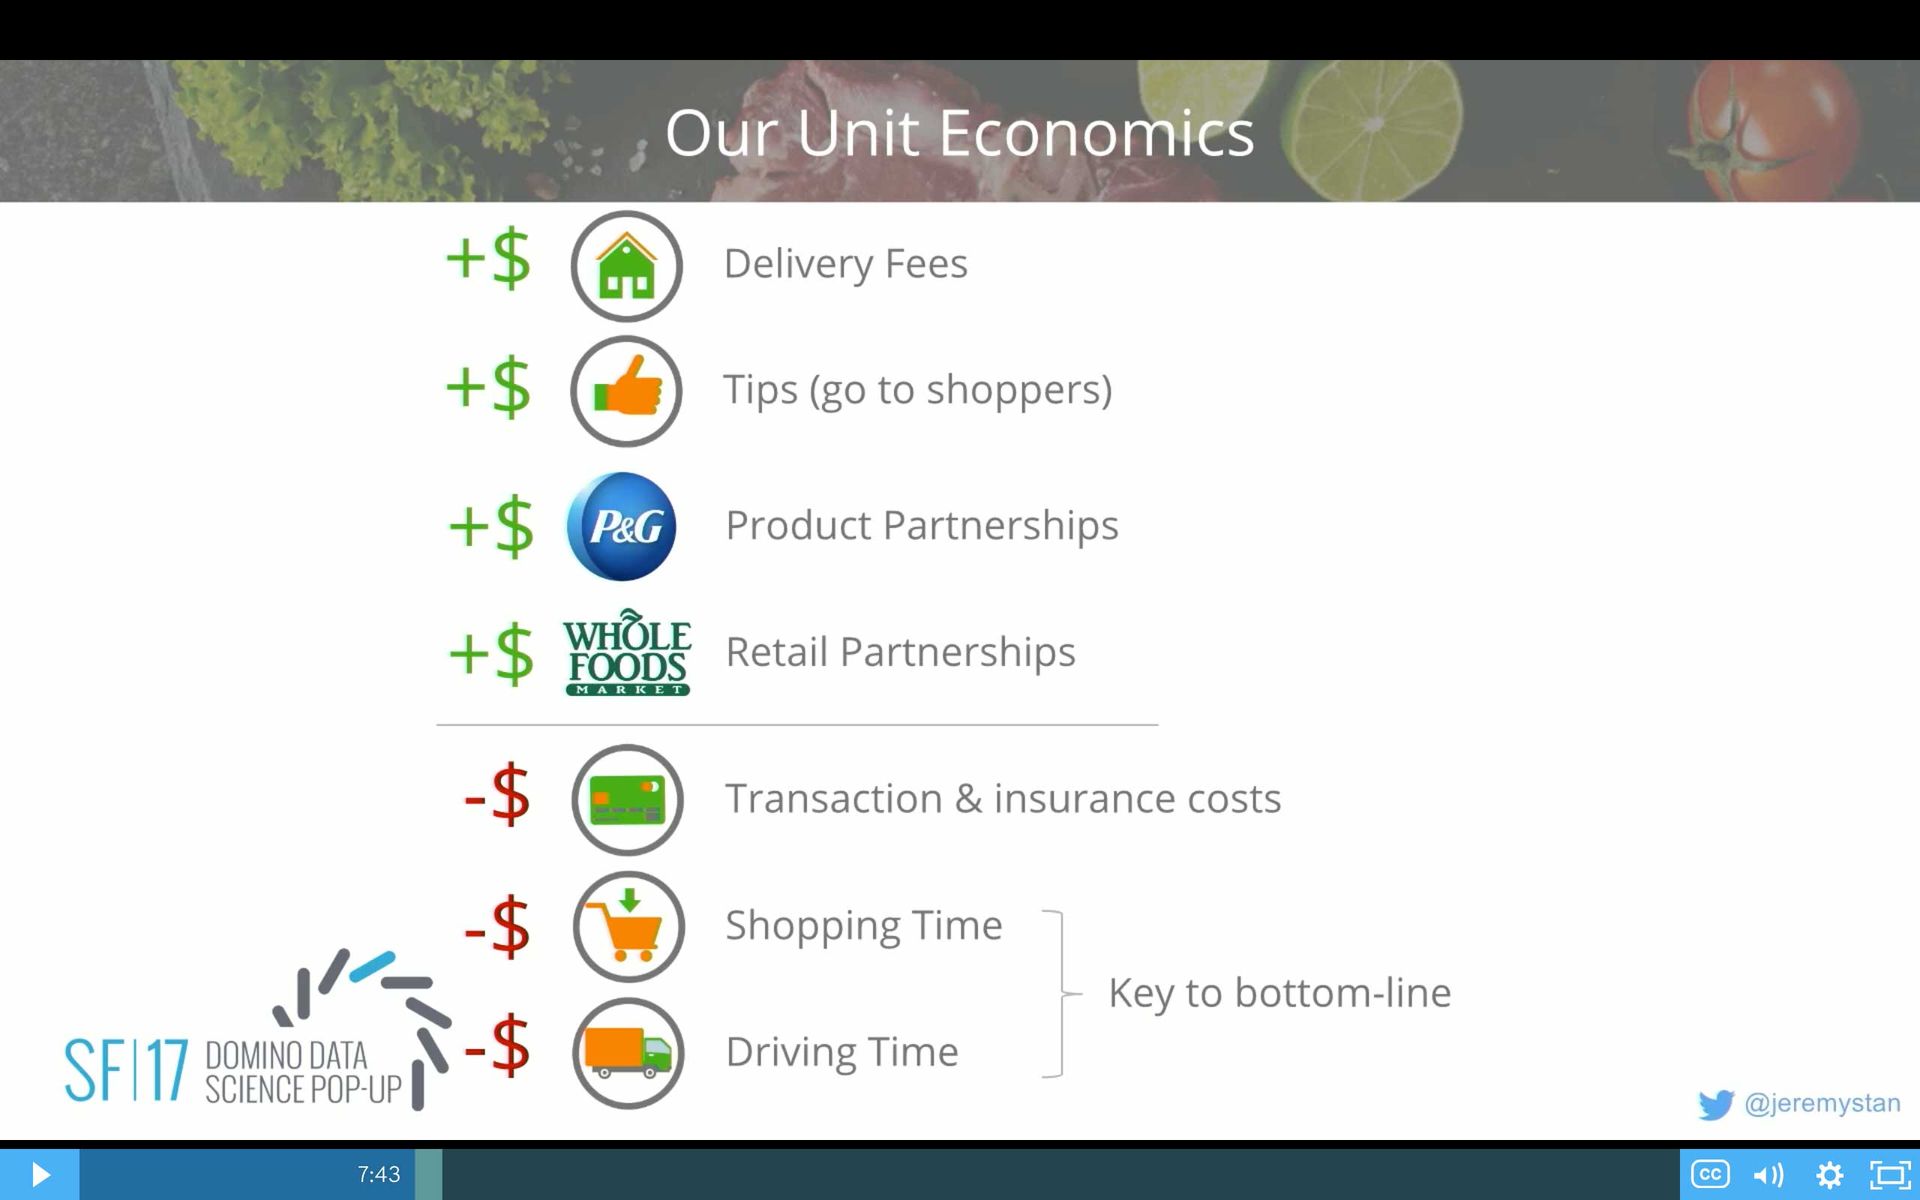
The first thing is there's a bunch of different streams coming in on the top. The first one is delivery fees. Those are coming from the customers. Maybe they're spending $5 to get a delivery. Or they can buy an express membership; spend $150 for the year and get as many deliveries as they want. So that's one form of revenue.
The second one are tips and service fees. Those all go to the shoppers, either shoppers that are doing orders end to end or shoppers that are sitting in the store. That helps to pay for the labor costs. But it's actually not enough.
The third are product partnerships, companies like Procter and Gamble and others that are willing to do advertising. Something like 30% of all of the dollars we spend on groceries are spent on advertising. That's where that money goes. It's not to grow the food or distribute the food. It's to convince you to go buy it. So there's a lot of interesting opportunities for advertising.
And we get revenue from CPGs. And then we also get revenue from the retail partners. The companies like Whole Foods themselves, they've got a fixed investment in a store. If they can get 20% more deliveries, more orders out of that store, that's really worth something to them.
In terms of costs, we have the prosaic transaction costs, credit card processing, insurance costs. But the dominant costs are the time that it takes to shop for the groceries and to drive. If we can allow that to happen faster and more efficiently, this whole system can ultimately make money. We can reduce prices for customers, and it can be a profitable venture.
We've done that. We've created profitable unit economics. We can make more money than we spend on every single delivery. And we're continuing to push that pretty aggressively.
This is a chart of minutes per delivery just indexed to the max of when we really started to focus on optimizing the efficiency of the back end. We're roughly 40% faster than we were before. We're continuing to push aggressively. Overall things have gone well.
Apoorva, our CEO, was at TechCrunch late last year. He mentioned that our revenue has grown 500% since the beginning of last year. 90% of our customers are repeat customers. Express customers, they spend about $500 a month on average. Once people use this service, they really do use it frequently. We expect to be cash flow positive—that's all costs included—in the next 12 months.
So you understand Instacart, a little bit about how we make money. Let's talk about data science... What are the challenges?
Challenges We Try to Solve with Data Science
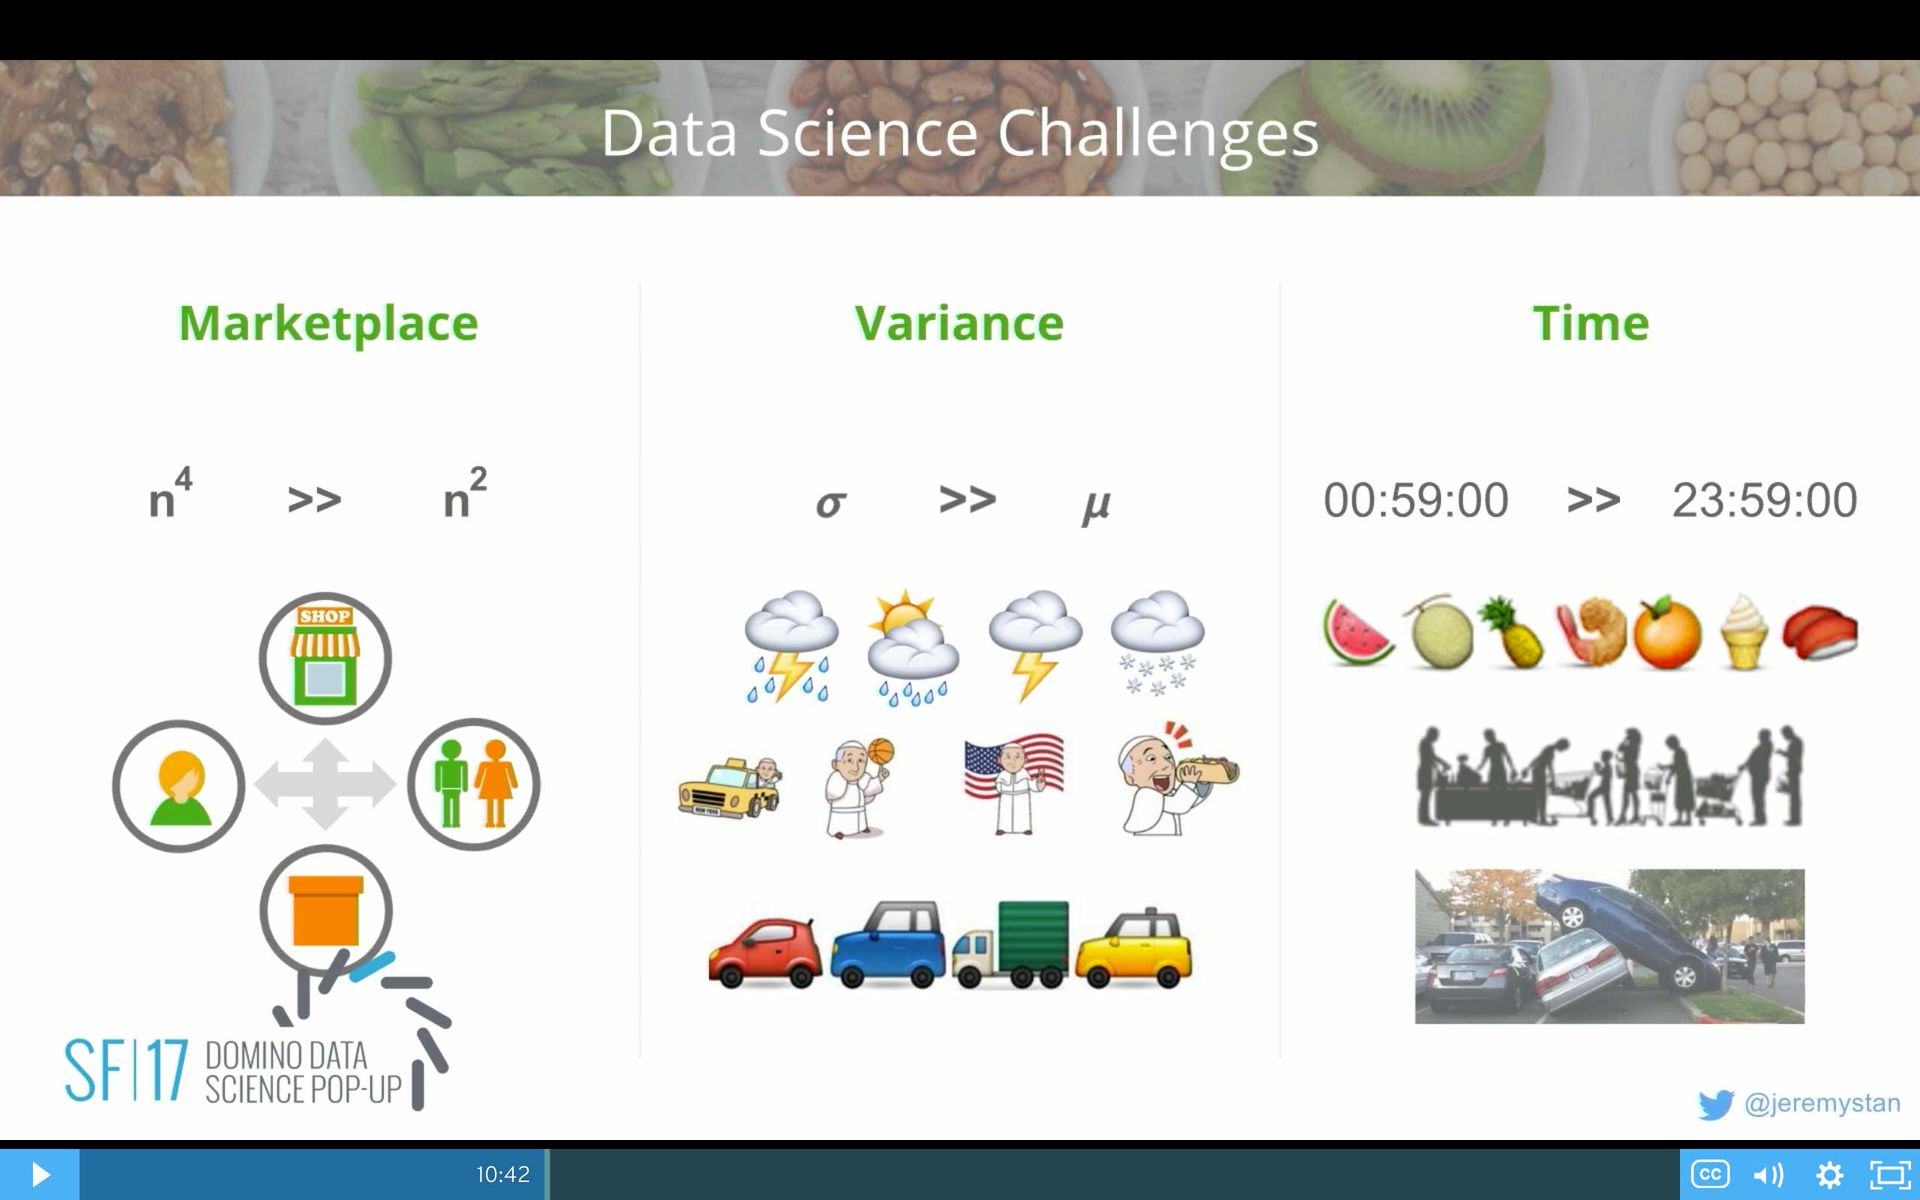
The first one is that this marketplace model... I'm used to businesses that maybe had one side, maybe two sides. When you get into four sides, you've got to consider the needs and objectives of all four sides. Every pair of interactions is a significant opportunity and a significant source of data, a significant potential place to influence and affect things. It turns out that the four-sided marketplace is a lot more complex than just a two-sided marketplace.
The second one is variance. More often than not in data science applications, we spent a lot of time thinking about means of outcomes. What's the most likely outcome or the best possible recommendation? It turns out in these kinds of problems, we care about the variance almost as much as we do about the mean.
There are a lot of sources of variance. Some of them are obvious. The weather, when it's really, really cold outside, how many of you want to go to the grocery store? Not very many, so a lot of you go onto Instacart and you place your orders. If you were a shopper and it's really, really cold outside, how many of you want to go out and deliver groceries? Not very many, so you might not come and work your shifts. These two things actually work against us and make it really hard to fulfill demand. So weather events are really challenging.
There are also lots of special events, like the pope. He came to the United States and visited a whole bunch of cities and just created gridlock and turmoil for Instacart, as those processions went through the different cities. There's the equivalent of a pope visit happening every week in some city in the United States, and it's significantly disrupting our operation. Then there's also traffic patterns themselves.
The last big challenge is time. We're trying to do something in an hour that typically has been thought about as being done in a day. Trying to move something that takes a day into an hour is like really radically different. We've got to pick all of these groceries in a store location. We've got to stand in a checkout line that can have a variable queue length. We've got to park the car at the retailer and at the customer address. Sometimes our shoppers park the cars underneath other cars in order to make deliveries on time. That's how crunched for time we are.
So these are some of the challenges that we try to face.
When we think about optimizing for minutes, we have a saying at Instacart: Every minute counts. It's one of our core values.
There're two big classes of problems:
- One of them is how do you effectively balance supply and demand? We have a lot of demand coming from customers. We've got a lot of supply potential from all of our shoppers. How do we ensure that those two are in balance? If there's too much demand and not enough supply, we have to turn customers away. If there is too much supply, not enough demand, we're going to have people sitting idle and not making a lot of money, and thus having to subsidize that. It's not good for them or us.
- Once we've balanced supply and demand, we've got ideal staffing levels and people in stores or in geographic locations, we've got to do the routing itself. We've got all of these deliveries. We've got all of these shoppers. Which shoppers should do what sequence of deliveries, in order to make sure that the deliveries are on time and that everyone moves as fast as possible?
Let's talk about a few of the key problems in data science here.
The first one is actually kind of funny—it's "what was demand?" Not "what will demand be?" It's just "what was it in the past?"
That's not an obvious thing to answer. The reason is a visitor comes to our site or our application, and they'll see a bunch of delivery windows. For some of these windows, we might have sale pricing on, or we might have busy pricing in others. We might have turned off windows entirely, because we don't have enough shoppers.
There're really three different outcomes that can happen for every visitor:
- They can either go ahead and checkout.
- They could have had the intent to checkout, but they walked away, because we didn't have the availability that they wanted for delivery options.
- They could have never had intent to begin with. Maybe they were just browsing and building a basket for the future. Or maybe we had a big opportunity or press release or something like that. And people came to check out the site. All of you are going to come to Instacart later, and we're going to think, oh, we've got all these deliveries to do, but you're not going to check out, because you're just signing up for the experience.
The question is how do we distinguish between these?
What we do is we look at every visit, and we build a model to predict what's the chance that any given visitor will, in fact, check out given characteristics about that market and that visitor but also all of the characteristics of the demand profile that they saw, of the availability profile that they saw. What windows were open? What windows were busy priced, etc?
If you can build that model well, you can essentially predict what's the chance every visitor would check out under any given circumstance for availability. Then run that prediction with 100% availability for everyone, and you get an estimate for the intent. If everyone had seen 100% availability, how many deliveries would we have done?
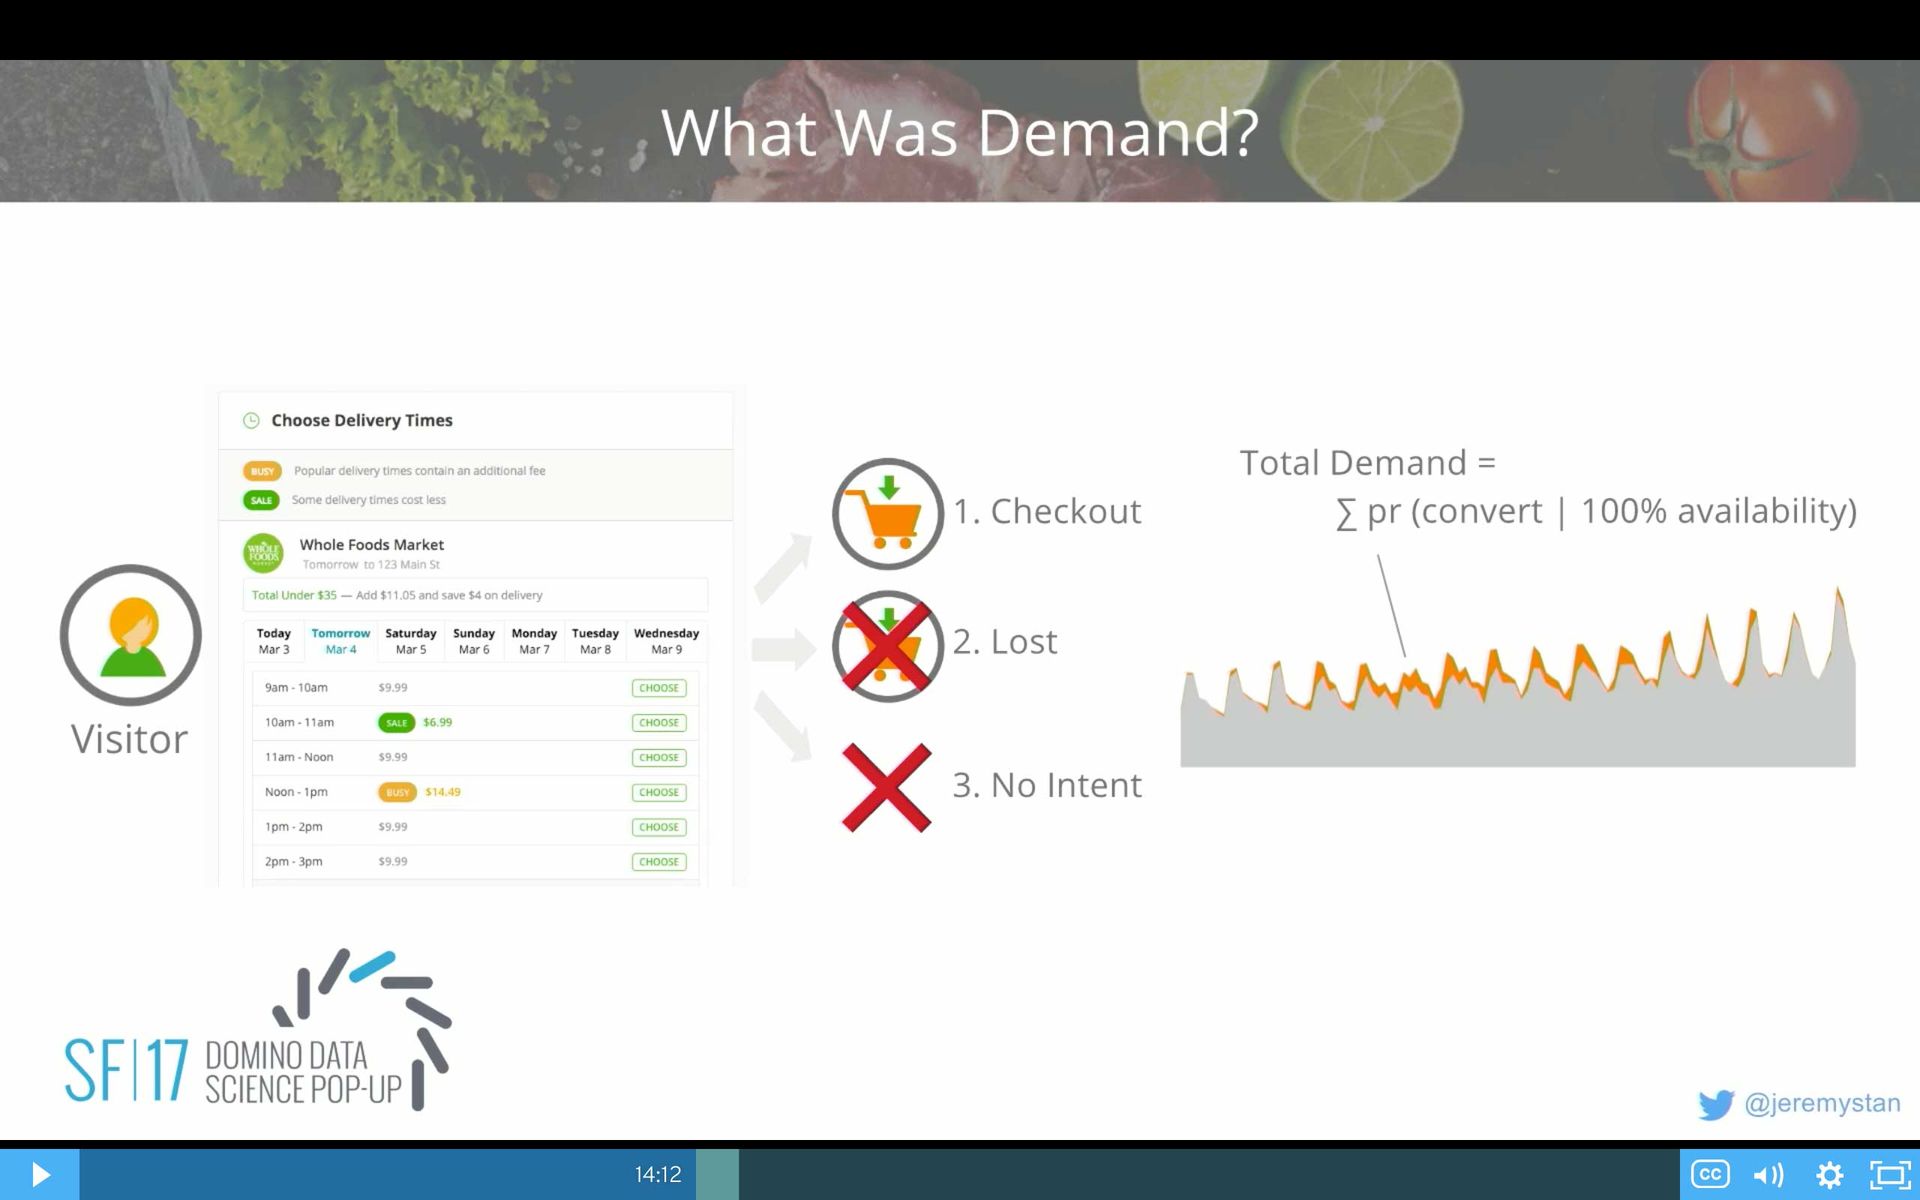
If you look at this time series, this is for a small segment of the business. This gray are the actual deliveries. The orange are what we call lost deliveries. These were opportunities where we believe customers came to the site and walked away, because we didn't have availability. But they would have converted if we had.
This is really important, because if we're going to do any kind of scheduling, or staffing, or forecasting, we want to do it on the total demand so that we don't continue to repeat the mistakes of the past and end up in a data science death spiral, where you just continue to de-staff, because you're not able to meet demand. And you end up with fewer and fewer people. So it's a pretty critical foundational problem.
Once we have that, we have to forecast what's going to happen to this demand in the future. And this is, at one level, a very classical time series modeling problem.
Maybe we're trying to make forecasts for demand by region, but we have to do it at the retailer. If we take one of those regions, there are a whole bunch of different retailers, and we're going to have people staffed at those specific store locations. So we'll have to go down to a store location, down to day of week, down to hour of day.
We end up with many millions of these forecasts that we really would like to be accurate. We have models to try to predict the means. But it turns out that, again, we're as interested in the variance as we are in means, because what's different of our staffing methodology is we need to care about keeping a certain role 100% utilized all of the time. And so we care about what's the lower bound for demand. Other roles maybe are larger queues and can be more flexible. We need to think about the upper bound for demand. So this is an interesting challenge for us.
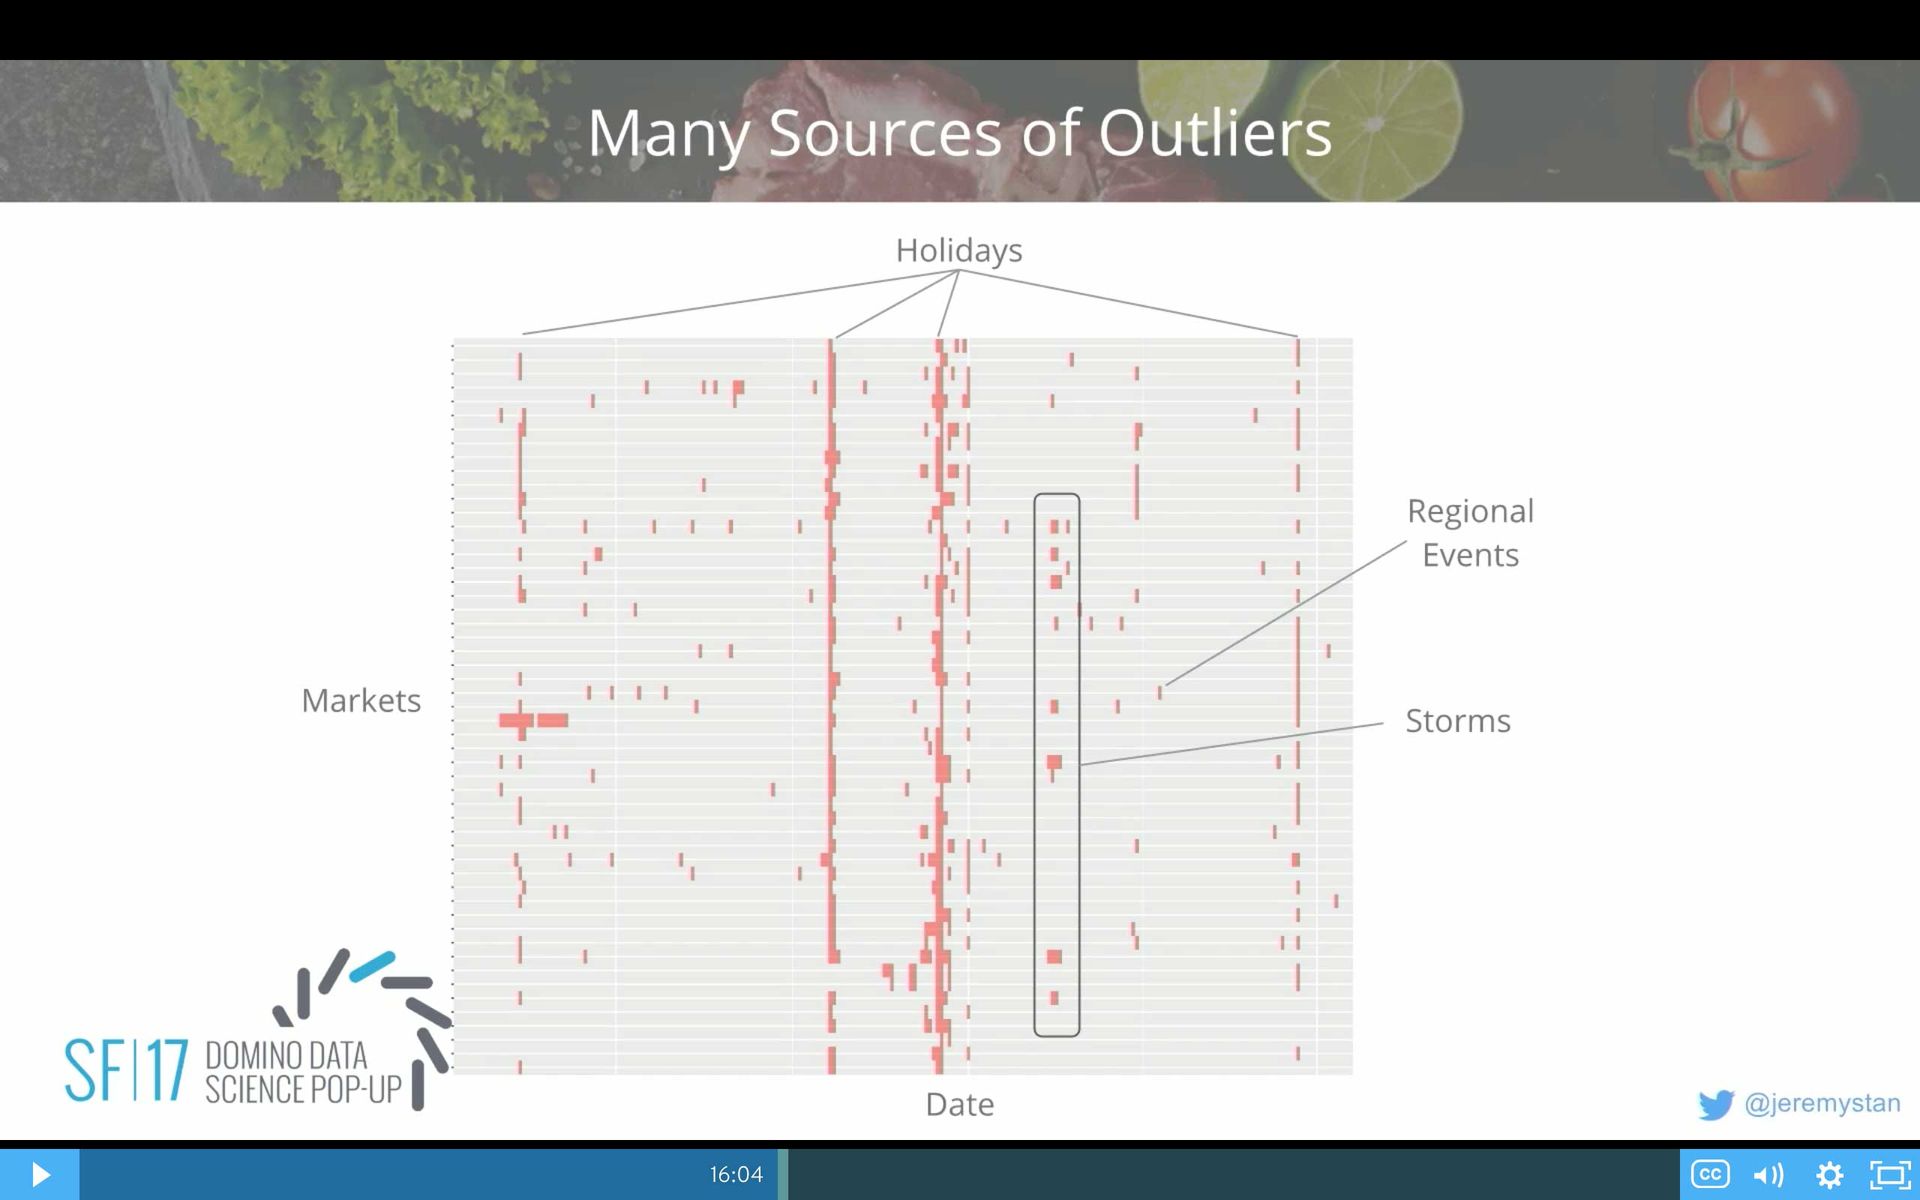
There's also a lot of different sources of outliers. I talked about this a little bit earlier. This is a snapshot of a part of a year around the holidays. You can see different geographies across the vertical axis and time on the x-axis. Every red square is an outlier. It's a significant variation in demand for that geography on that day. Some of the big vertical stripes are holidays. They're consistent. They happen globally.
Those are pretty difficult for us still, because Instacart's only been around for four or five years, and we can go back and look at what happened last Thanksgiving or last Christmas, but it might've fallen on a different day. So there's a lot of guesswork and analysis to try to figure out how to handle even special events like holidays.
Then there will be regional events that are really one-off or storms that might affect whole geographies at a time. We flag these, try to remove them so that we aren't biased, and then try to make anticipated guesses for what's going to happen in the future.
All of the models that we have for doing forecasting we back-test pretty rigorously. We have a framework in-house where we'll go back in time, and for any one of the geographies that we might have or cells of the forecasting matrix we might have, pick a day, hold it as an independent holdout set, build the time series models going backwards in the past, and make a prediction out into the future and see how good to the time series forecasts do one, two, three, four, five days out for any one of these cells.
Then we can take lots of different algorithms and plot their performance over time. One of the interesting things we find is that during the holidays, which is around here, all of the algorithms really suffer. Variance goes up maybe three or four-fold around the holidays. That's just a very difficult time for us.
Some models actually perform better during the holiday variance, but not as well when we're out of the holidays and things are more predictable. We actually need to think about using different models at different times, given the overall level of volatility we have.
In the end, this is really hard. And you can't get it perfect. We look at different markets that start to become more and more mature and more and more dense. It's not like we can get, as markets get larger, the error of our forecasts down below 1% error. It just doesn't happen. There's a cap. There's always volatility.
So we have to have systems that can do shock absorption in real time over the course of the day. For any one of our stores, we'll have forecasts going out into the future. How many deliveries do we think we can do given the staffing levels that we have and the commitments we've made already for shoppers? How many additional deliveries could we take in? As long as we have a lot of additional capacity, we leave those windows open.
As soon as capacity starts to look like we're going to run out in time, we begin to busy-price. And once we're at the point where we're sure we can't take any additional ones, we'll turn the delivery window off entirely. These are the more real time demand shock absorbers we use to recover from the errors.
Let's switch now. We've talked about balancing supply and demand. Now suppose you've got 1,000 deliveries coming in to San Francisco in the next 4 hours. You've got 300 shoppers. Some of them are dedicated in stores. Some of them can go into a store and do deliveries. Some of them are just doing deliveries. How do you route them all? How do you decide what those 300 shoppers are going to do, what of the 1,000 orders?
Well the first thing that you have to do to solve that problem is predict how long it's going to take any individual shopper to do any task in the system. A big part of that is because we've got delivery windows. We've told you you're going to get your delivery within 3:00 to 4:00 PM.
We can measure the happiness of our customers, the rating that they give us when we deliver. If we are late, customers are really pissed. They don't like that. The happiness is definitely negative. Turns out actually if we deliver in the last 5 or 10 minutes of the delivery window, customers don't really like that either.
It's the whole cable installation that you have. I've moved so many times. I've gone through this so many times. You book a four-hour window, and they show up at 3 hours and 50 minutes into the window. You know they were just sitting outside waiting to show up at the very last possible minute. It really angers you as a customer.
We see the same kind of thing. Whenever we are just barely on time, customers don't like that.
They don't mind if we're early. They dislike it if we're 30 minutes or an hour early—what I call wake-up-the-baby early. They don't want that. But it's OK if we're a little bit early. So understanding when the deliveries are going to be due is really important to meet this.
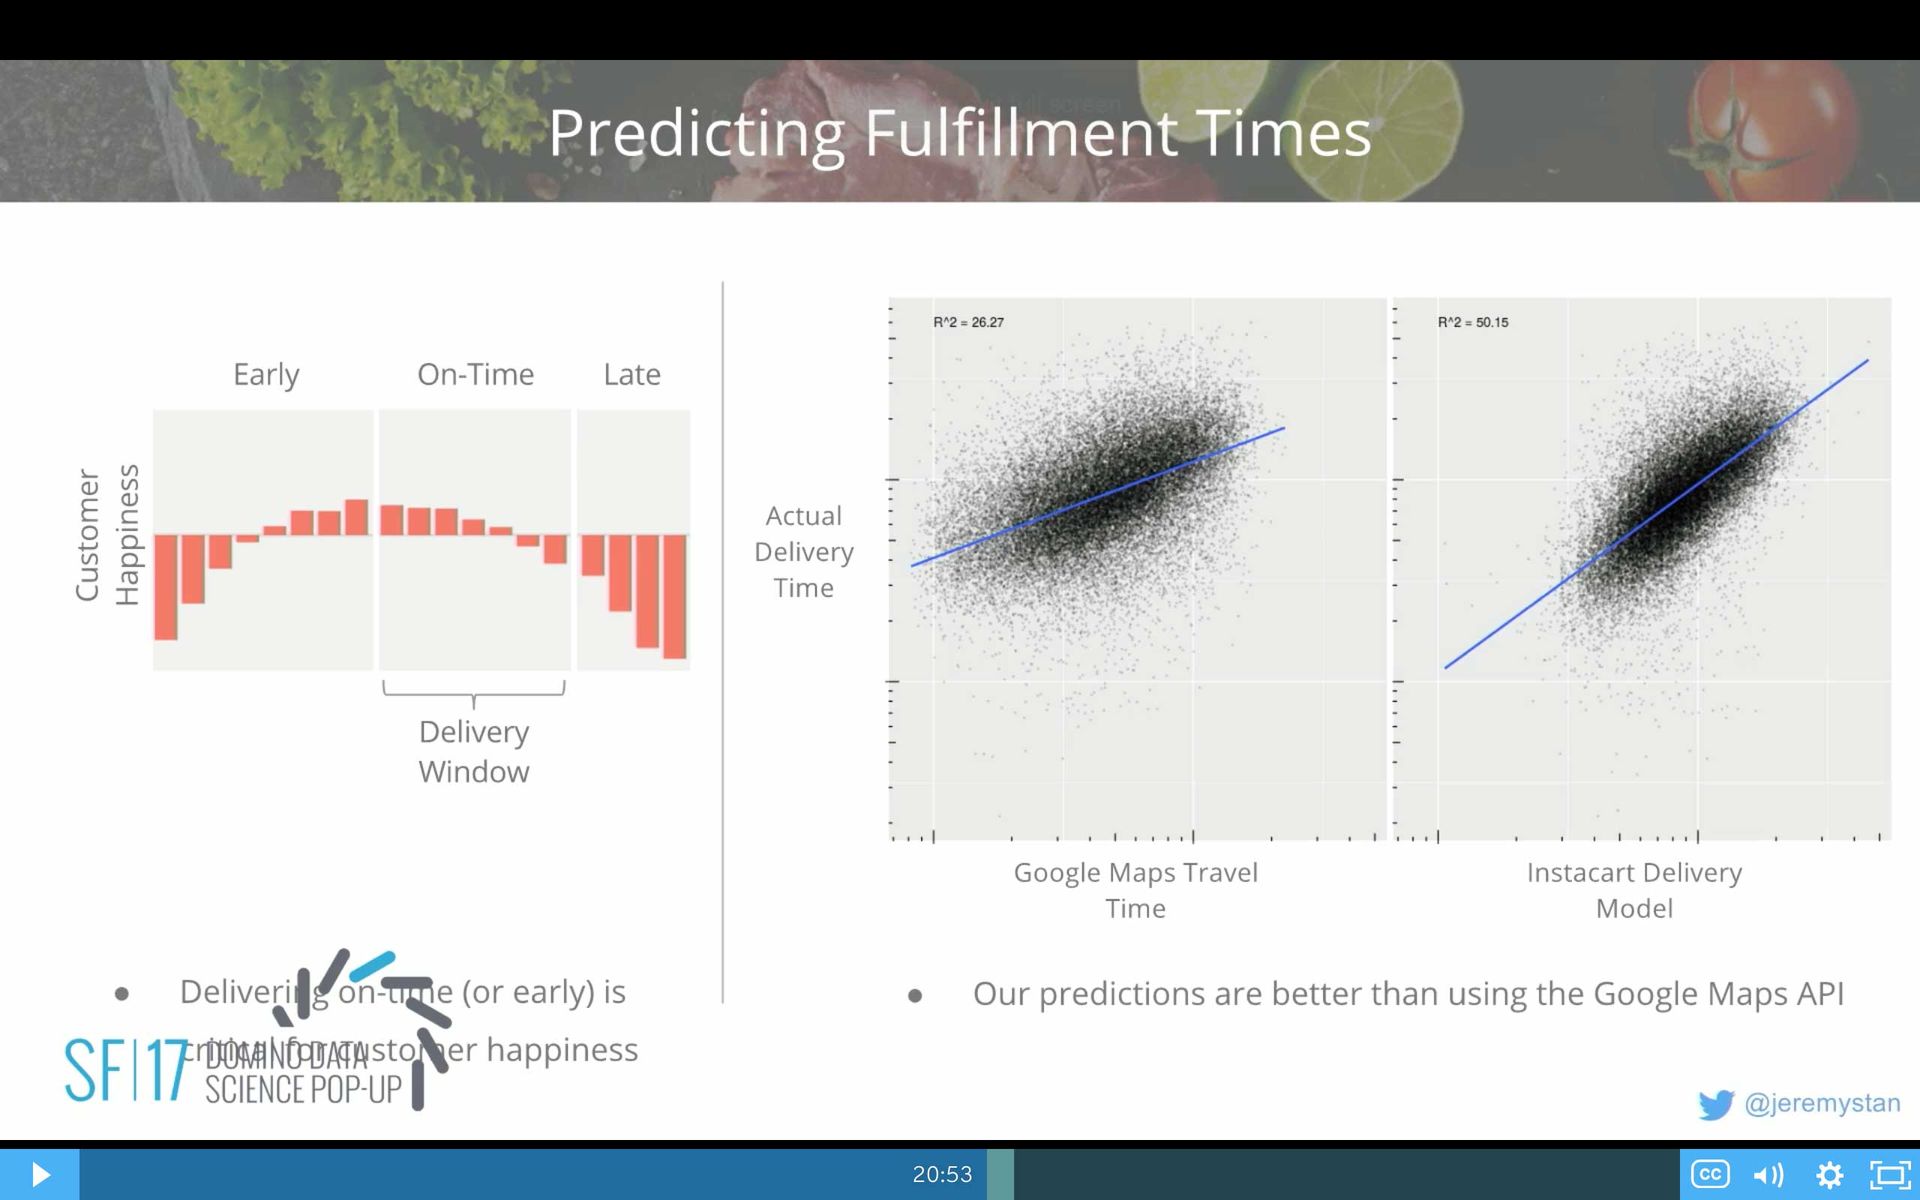
You might think we could just use Google Maps travel time estimates. And we certainly can. It's not an unreasonable place to start. We've built our own models that outperform the Google Maps travel time, in large part because our drivers aren't the usual drivers. They're not doing the usual things. These are oftentimes repeated trips to the same store location. They actually have to drop off groceries. Go inside the store. We have to model all of those components. And so the models that we build in-house can actually do this significantly better than the Google Maps API.
The other reason not to use Google Maps API is we actually have to make these predictions for all of the combinations we might consider. It's not enough just to make the prediction for the final one that we decide upon. We have to evaluate a candidate set. Those predictions have to be made inside of the system that's doing the optimization itself. You can't wait for 100 milliseconds to go out to Google, and you can't query Google at the volume we would need to get those estimates.
Let's look at a real example of a delivery combination.
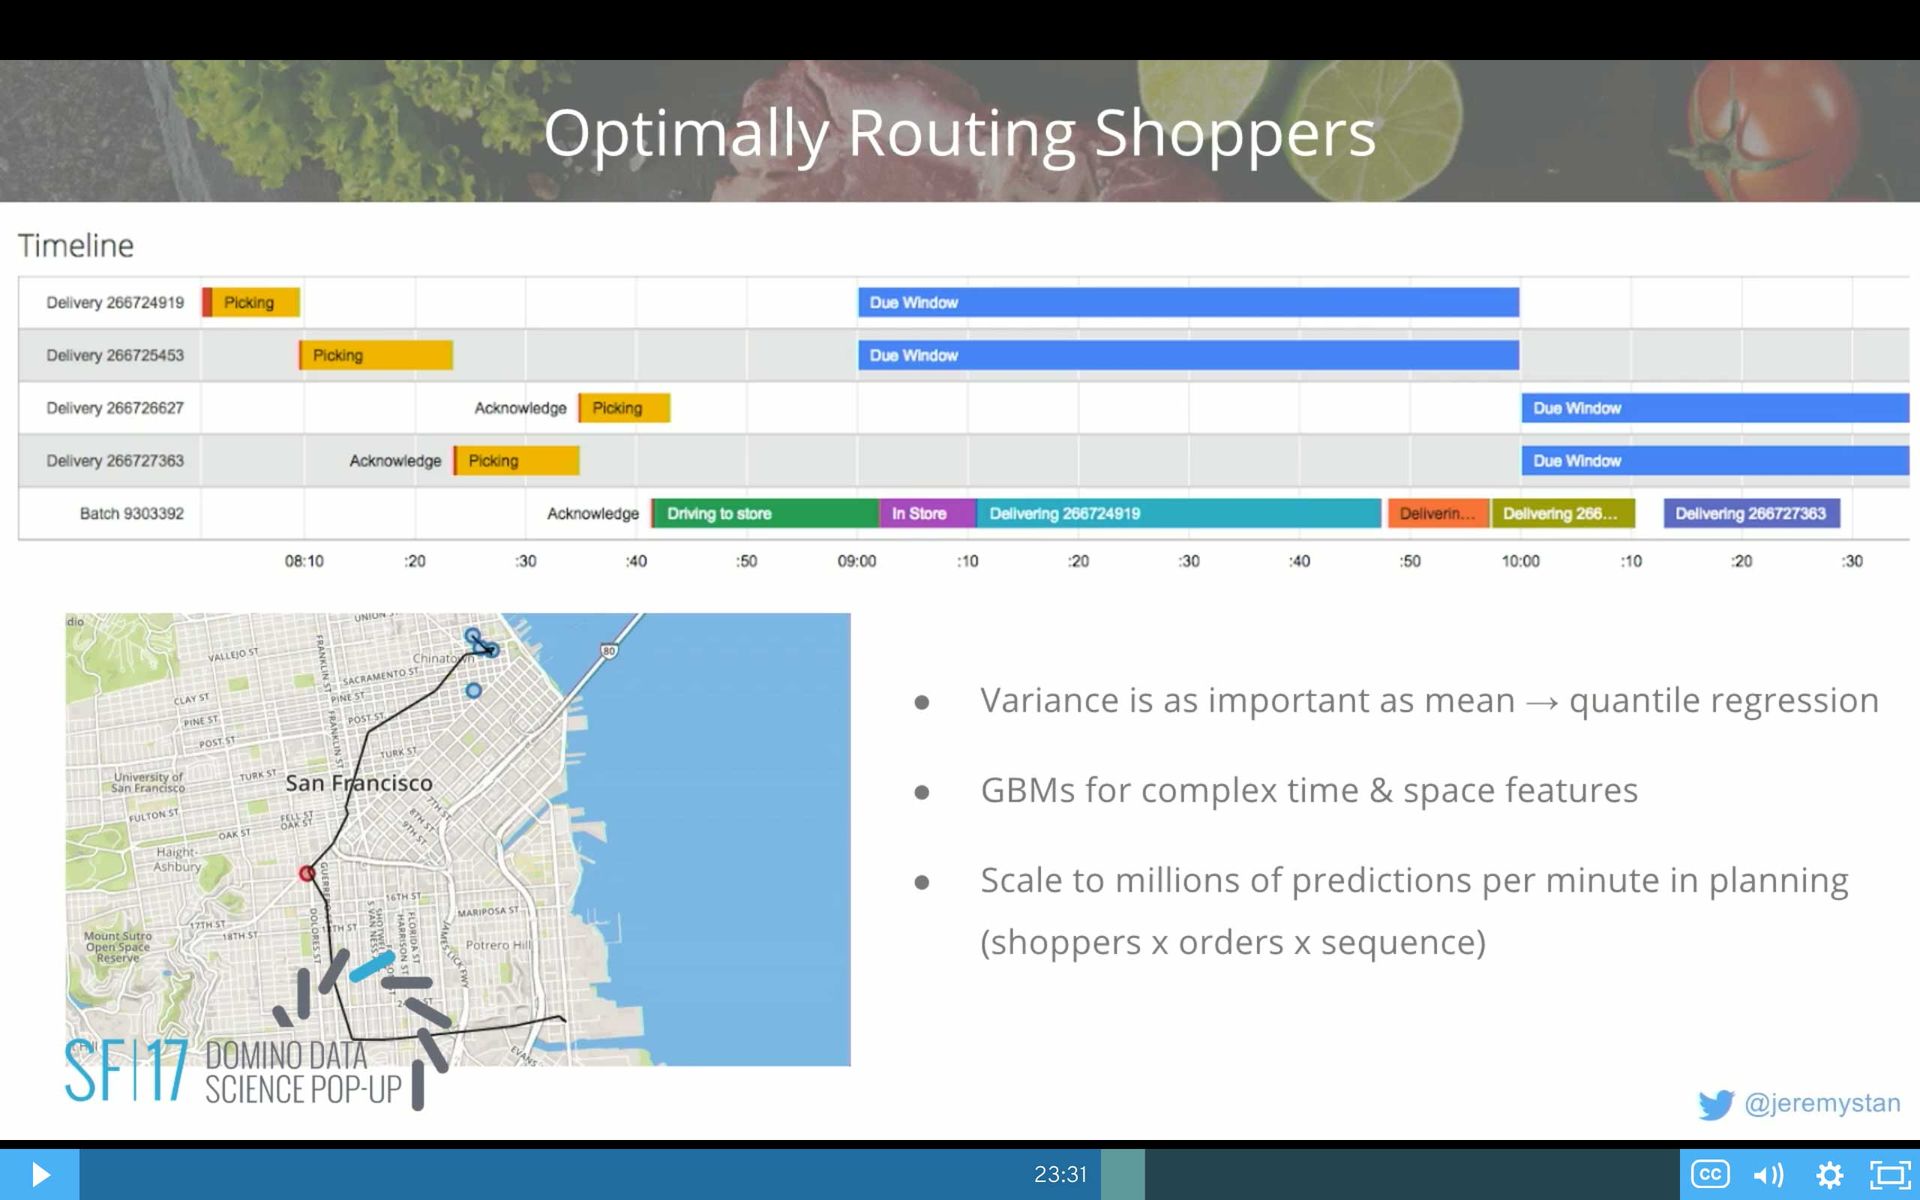
This is a situation where we've got four different deliveries. Each of these stripes is a delivery. We've got the different due windows. Two of the deliveries are due between 9:00 AM and 10:00 AM. Then the next two are due between 10:00 AM and 11:00 AM, just as an example.
The first thing that we do is in this case, we're going to assign all of these deliveries in the red and yellow on the far left hand side to shoppers that are going to be in-store and just pick the groceries for those deliveries. Those can happen in parallel by different in-store shoppers.
Then we're going to pick a driver. We're going to assign the driver, even before the picking is completed back here, to go drive to the store. Go into the store. Pick up all of the bags. Deliver the first one, the second one, the third one, and the fourth one. And you can see that play out in the map below. They drive to the store location. They pick up the bags. So now they're at the store location. They pick up the bags. And then they do all of these deliveries in sequence.
That's a great batch combination for us. It's a great outcome. We've got one driver picking up four and doing the delivery. All of that driving time and first travel time are amortized over four deliveries. And we got all of them on time. We just barely made this one, so it was close. But they were all on time.
I think here you can really see why the variance is as important as the mean. Because by the time we get to this delivery, there are one, two, three, four, and possibly five previous steps that could have taken longer than we'd anticipated. That could have accumulated into that driver ultimately being late. If you've got a bunch of these things, and they're independent with high variance, you're going to have a lot of those situations where one thing goes wrong, and you end up being late.
We use quantile regression to make predictions. What's the—not the mean time—but what's the 93rd percentile likely time? And what's the 7th percentile likely time? We take into account the correlation of those variances across these steps in order to accumulate that variance out into the future.
For these models we use gradient boosting, decision trees. They're great. We've got complex time and space features. They can more or less memorize the data, which is essentially a lot of what we want to have happen here. We can scale them to many millions of predictions per minute when we're planning all the different combinations.
So this is what it looks like to deliver four. Now let's come back to the situation where we've got to deliver, say, 300 orders with 100 shoppers. Even if you just have three orders per trip on 300 orders, that's 445 million combinations of deliveries and groups of 3 with 100 different shoppers. We've got to do that every minute for every market... And this is a small example. So you can intuit that the right answer isn't to enumerate all 445 million options and stack rank them, pick the best one, and then pick the next best one. That doesn't quite work.
Our objectives here, just to re-anchor on that: We want to maximize the number of items that are found. This is important, because we could actually pick—this is an example from Whole Foods in Manhattan, and the glare is a little hard to see—but there is a store location here, here, , here, and here. These are all the deliveries spanning out. We could pick it from multiple different store locations. Maybe one that's farther away has a greater chance of having the Greek yogurt you really want, so we could trade that off, but we also want to maximize the probability of delivering on time within your window, and we want to minimize the total time we spend over the entire set of the deliveries actually doing the delivery.
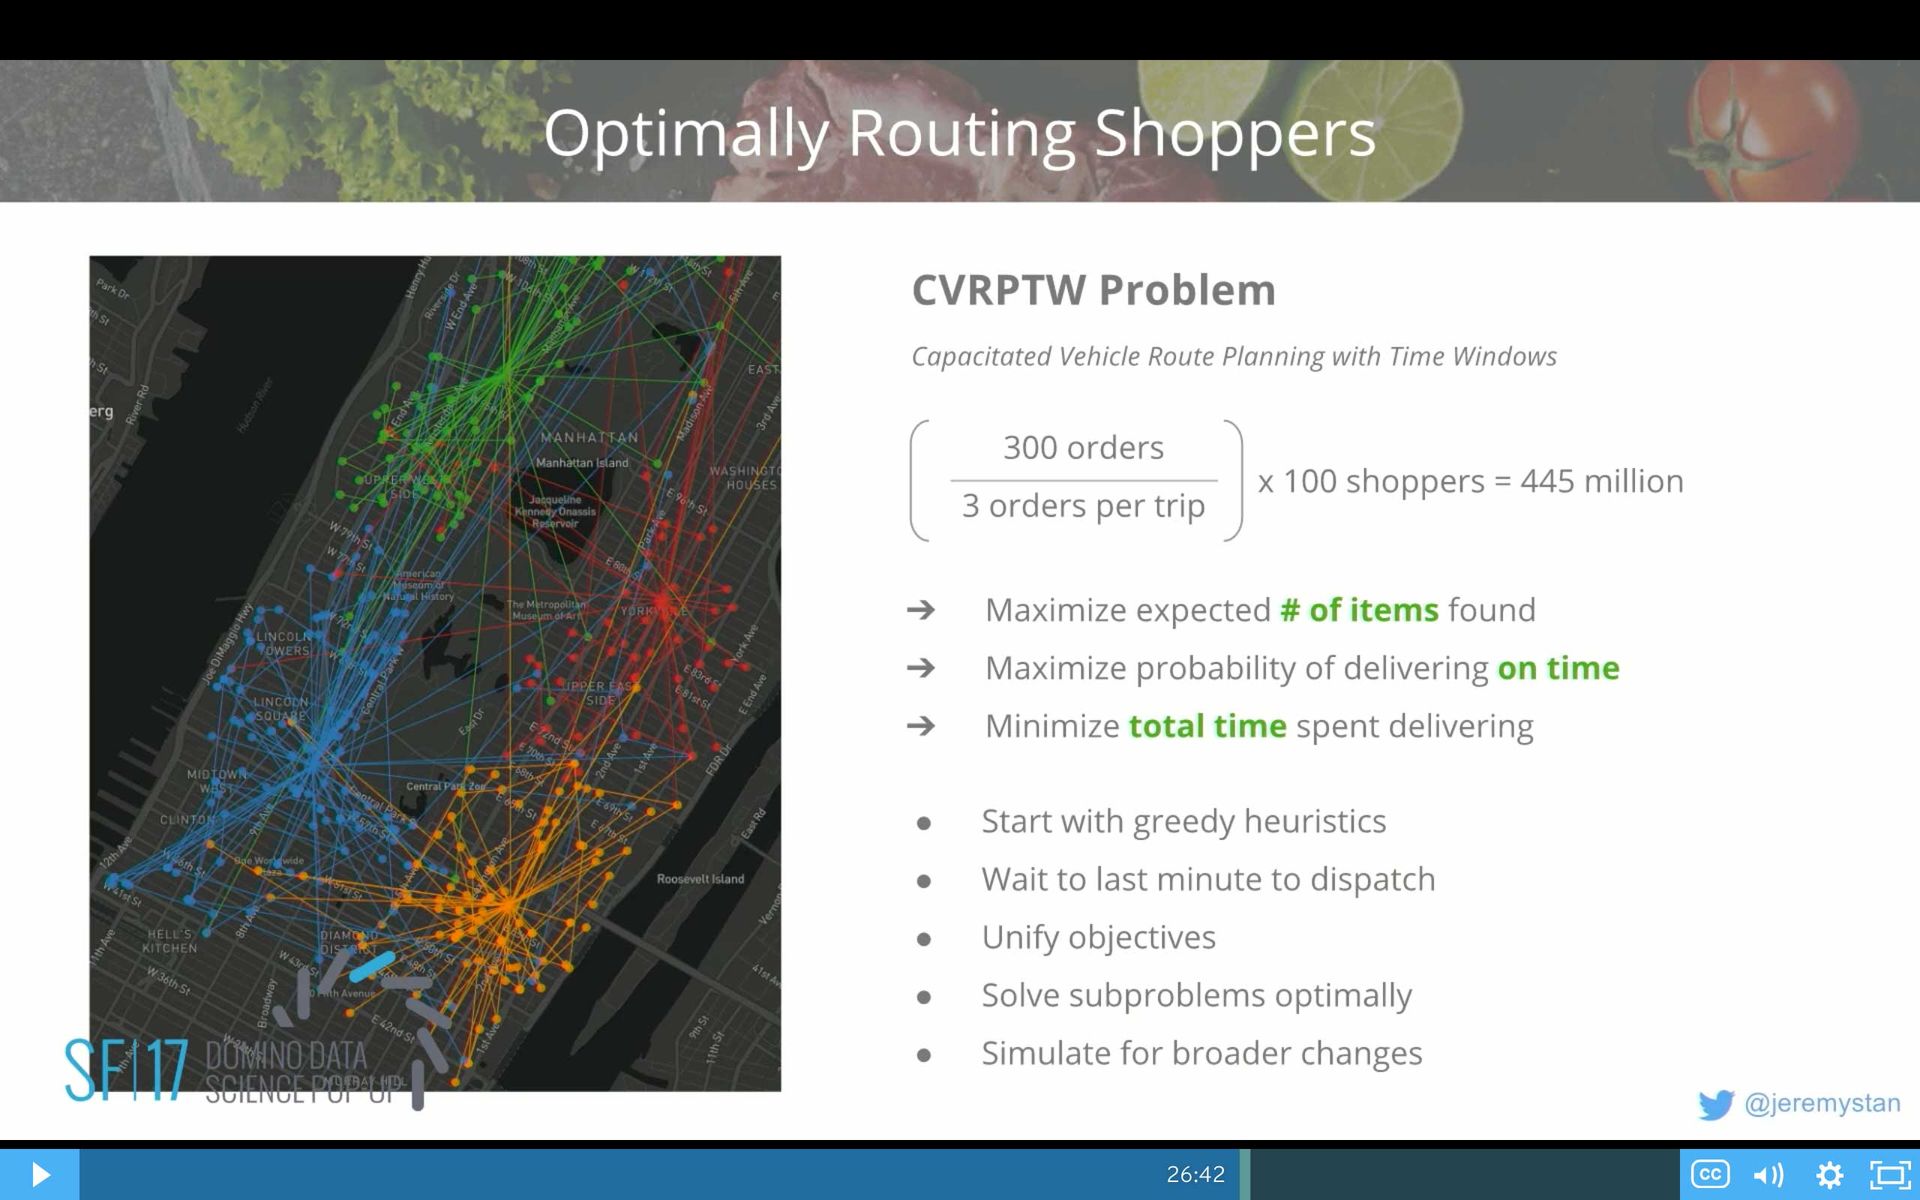
Those are our multiple objectives. Really you can start with very greedy heuristics. Come up with a simple approach of aggregating together possible deliveries and prioritizing those aggregates. The very first algorithm that we used was even simpler than that. What delivery is most likely to be late next? Which one's due next? Let's find out. Can anybody do that one on time? And assign it to them. Then is there any other delivery we can add on to that one? And just continue to iteratively go through in a greedy fashion like that.
That's how Instacart was started. It didn't need to have a super complex. operations research scientist solution figuring out the global optimal solution or heuristics to try to scale. We just started with greedy heuristics and waiting to the very last minute to dispatch.
Since, we've made huge improvements over that. One of them is trying to unify all of these objectives. It's easy to start out just putting constraints on these objectives, but if instead you can turn them all into dollars for Instacart, what's the net value of all of these outcomes? Then you can unify them. You can end up with a lot better optimal solutions.
The second part does it take different components of this problem. Maybe it's the creation of combination of deliveries into batches that could be done separate from the assignment of shoppers to those batches, and solve those sub-problems optimally. We found significant gains from that.
At this point, what we're really focused on is simulations, trying to figure out how do we change the rules of the system, the tools that we use, to see what's going to make us be able to achieve an even better solution in the future. We can't do A/B tests in this kind of a problem, so we have to simulate different outcomes and run it over and over and over again to try to see what would happen if we introduced an entirely different change.
Net results over the time period I talked about earlier, we were able to reduce late deliveries by 20%, not increase the lost deliveries, while increasing shopper speed and the percentage of time they were busy by 20% and 15%.
It doesn't go easily. What ends up happening when you have these competing objectives is you start out someplace, maybe you're low utilization but also low last deliveries, and it's pretty easy to make a bunch of changes and swing all the way up to here, where you're high utilization, high lost deliveries. You can just tune constants and get there. The really hard work is how do you move that efficient frontier. Oftentimes it's lots of back and forth changes to try to slowly improve the efficient frontier.
How We Organize
How do we organize at Instacart?
First and foremost, we're very mission-driven. We take our engineering organization, we split it into teams that completely own some aspect of what we do. Maybe it's balancing supply and demand, or maybe it's the advertising products we have for our advertising partners. Each of those teams will have all of the skill sets they need—the engineers, the designers, the data scientists, the machine learning engineers, the analyst, mobile developers, a product manager... It's an open code base. They can do whatever they need to accomplish their mission within the Instacart platform.
Sometimes there are problems that span teams, span engineering and operations. We've got a huge field operations team out working with the shoppers, working with the stores. When we have these really big problems, we'll create what we call working groups. They're pretty rare. It should only be two or three at any given time. They're very matrixed. We try to really empower those teams so that they can make significant changes across the organization.
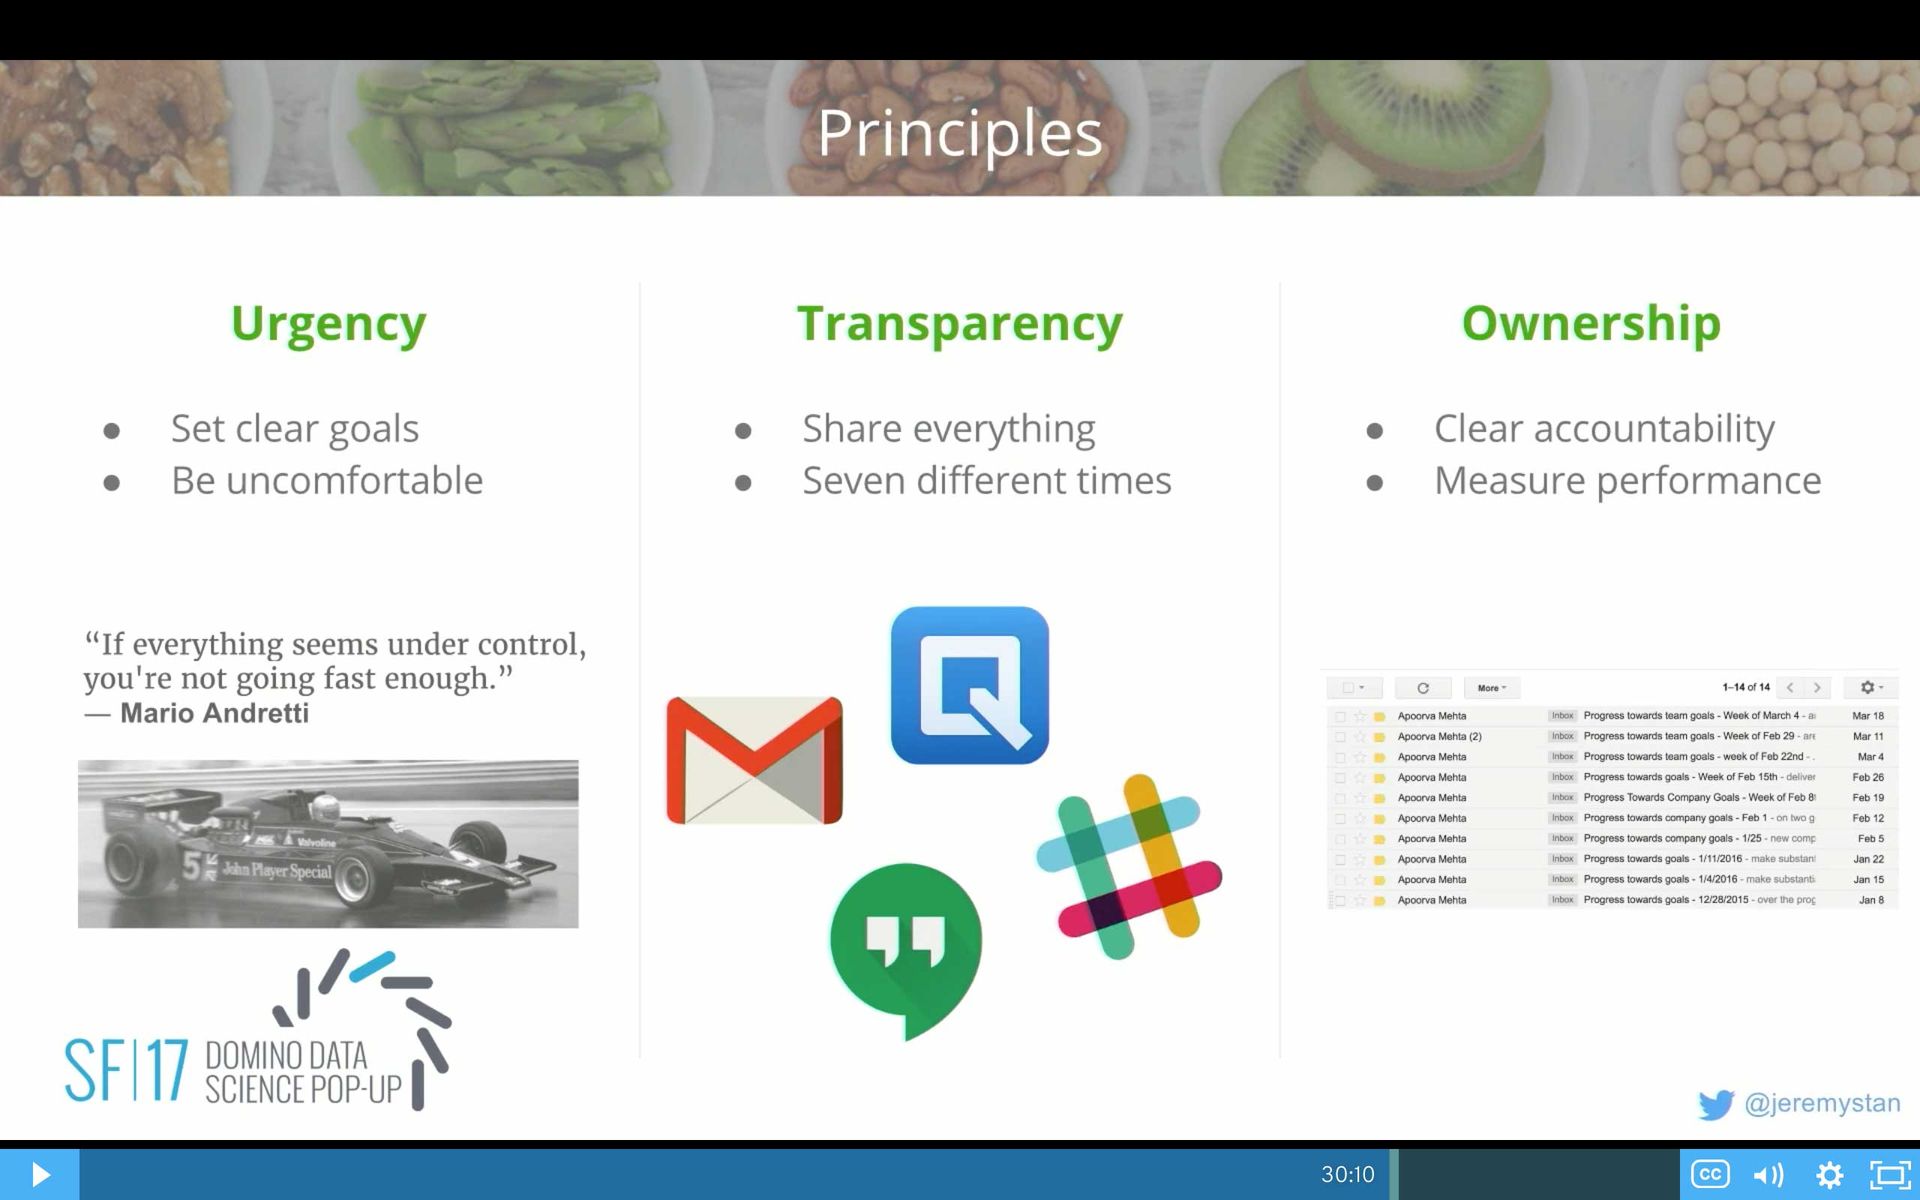
A few principles for how we operate: The first one is urgency. We set really clear goals, and we make them uncomfortable. We don't always hit them. We've missed some of the goals that we've set, but I've been shocked how many times I thought there's no way we're going to hit that goal, and we figure out a way to do it.
Mario Andretti said, "If everything seems under control, you're not going fast enough." I've just had to come to terms with that. I think it's a great way to think about these kinds of startups.
Second one is: Transparency. Internally we try to really share everything, make everything open and public by default so that people can access the information. I think one thing we've learned is that just because it's all available doesn't mean people can find it, so we're really having to work harder now to figure out how to make it searchable and accessible in the right way.
Then the final one is: Ownership. We have really clear accountability. We really look for and try to hire people that will take on ownership and drive things. Then we measure the performance. Our CEO or people on his behalf send out every week status updates on all of our key company goals, where we're at, what we're doing, and what we've learned.
So that's a little bit about how we organize. Not surprising, we're hiring. We've grown a lot. We expect to grow a lot more this year. If you're interested in roles, feel free to reach out to me directly. You can follow me on Twitter @jeremystan, or you can reach out to me on email, Jeremy.Stanley [at] instacart.com.
I think I'm about out of time, but maybe I have room for a question or two. I've got four more minutes. Wow, that's a lot of time. So any questions?
Questions
Q: So you showed that route correlating time of delivery with respect to the window. Do you have enough data on the satisfaction different users to see if an individual has certain preferences within those windows?
A: That's an interesting question. The question was I showed the graph correlating delivery time to customer satisfaction. And the question is, do we have enough data to tell whether or not some customers care more about delivery times versus item availability as an example?
I think we do. It's something that we've looked into in terms of building models to try to understand what drives customer reorder rates and ultimately our success. Most of when we're doing that, we're doing it to try to improve the product.
I think an interesting question would be, could we essentially personalize the optimization algorithm that I showed you to maybe let one customer's deliveries be a little bit late in order to make sure that we get them on time for somebody who really cares about that.
It's possible. I think what I find is anytime we do something like that, it tends to explode the computational complexity of these problems. And so we have to find some way of doing that that doesn't create an explosion.
Maybe it's a clustering. On the shopper side, we've got fast, medium, and slow shoppers. Some systems we can't account for the exact shopper that's going to be assigned, but maybe we can account for a cluster of the shoppers in their speed. Maybe something like that would work.
Another question over here...
Q: Yeah so in a store, there's always a lot of testing in regard to product placement. The tiles on the floor and the music that's playing can influence customer behavior. Are you guys running any tests in terms of different things that would influence product consumption?
A: So the question is, are we doing tests to influence customer behavior on the site? I could give an entirely different talk dedicated to that topic. We're doing hundreds of tests at any given point in time.
I would say that Instacart is a relatively straightforward product if you just think about search. Search itself is pretty complicated, but a lot of people come to Instacart with a set of groceries in mind that they want to buy. And so you can begin this service just facilitating that process, but it's not really enough for us. We want to drive discovery. We want to drive larger basket sizes and happier customers, ultimately create a shopping experience that's better than what you get in the store with all the data. We have a whole team, search and discovery, dedicated to this, and our product organization is constantly running tests.
Over here...
Q: Yeah so it's a little bit in mind with the question over there on the customer's preference. But does Instacart also have a preference for basically segmenting their customers in being high-value customers and low-value customers? Do you account for that in your algorithms too?
A: The answer is no. We treat all of the customers equally.
Some of our customers are value destroyers. If they do that in a way that is pernicious, we try to fire them. If they take advantage of our refund policy, as an example, and are essentially defrauding us, we try to fire them. But otherwise we've taken the stance of wanting to treat all of the customers the same. It's a philosophical stance.
There are things over the long term, but by basically trying to have a consistently high standard of service for everyone, I think, can be ultimately better than making suboptimal decisions. And treating some customers better than others can create kind of a vicious loop or cycle.
I tend to try to look for things that are going to move everybody up and focus on those things. If we run out of those options, maybe we'll have to do more of that. Other questions?
Q: Hello. You mentioned you got better results when you were able to normalize on a dollars per unit. How did you come up with that? Were the numbers hard or variable?
A: You lick your finger, and you stick it up in the air, and you go—so it's interesting. It's probably the thing that is most difficult to do. What's the value of a lost delivery?
I can tell you what the value of an idle hour is, because we might have to compensate that shopper for that idleness, so I can turn that into dollars. But it's much harder to turn a lost delivery into dollars or some other bad customer experience.
We spent a lot of time—it's a combination of financial modeling for what we think long term these things are worth, and then grossing those up for the long term customer effect and the network effect. I think what probably matters the most, though, is that if you don't have that, if you haven't made that explicit, it's implicitly being decided in the system.
What I found was it was actually being implicitly decided 50 different ways for 50 different applications or 50 different markets, and that in and of itself was bad. So putting a number down and saying we're going to rally around this number to drive a consistent philosophy and approach, and then we can tweak that number maybe, or put boundaries on other controlling metrics that we care about to protect ourselves.
Q: So you found that the consistency from a explicit statement was more valuable than an implicit variable?
A: Yeah, I think we're all looking at metrics all the time. If we were always unavailable, we would know it, and we would fix it. So we tend not to let these bad things happen. It's just not explicit.
Thank you very much. I'll stick around for a little while for further questions.
Banner by Lucinda Jolly, CC BY-SA 4.0, via Wikimedia.
Summary
