Data science problem-solving for novices
Josh Poduska2021-12-07 | 11 min read
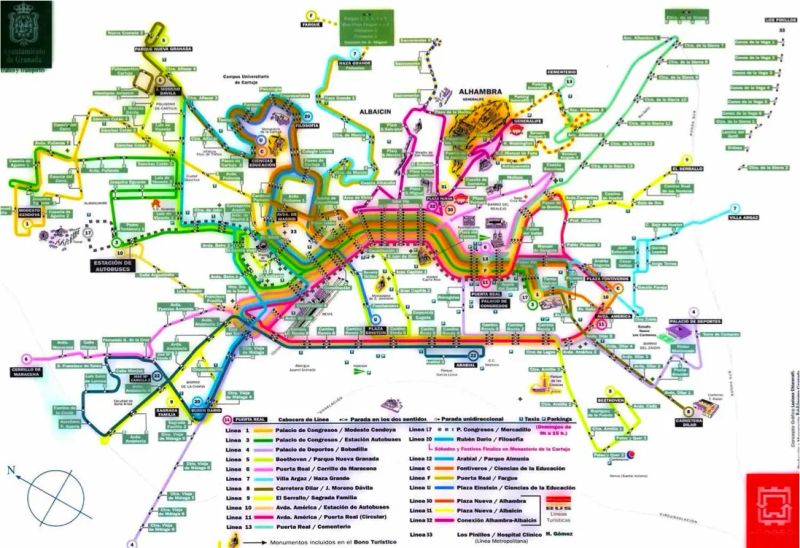
This article gives an overview of data science, and then walks through a real-world example of applying data science to transportation planning.
What is data science?
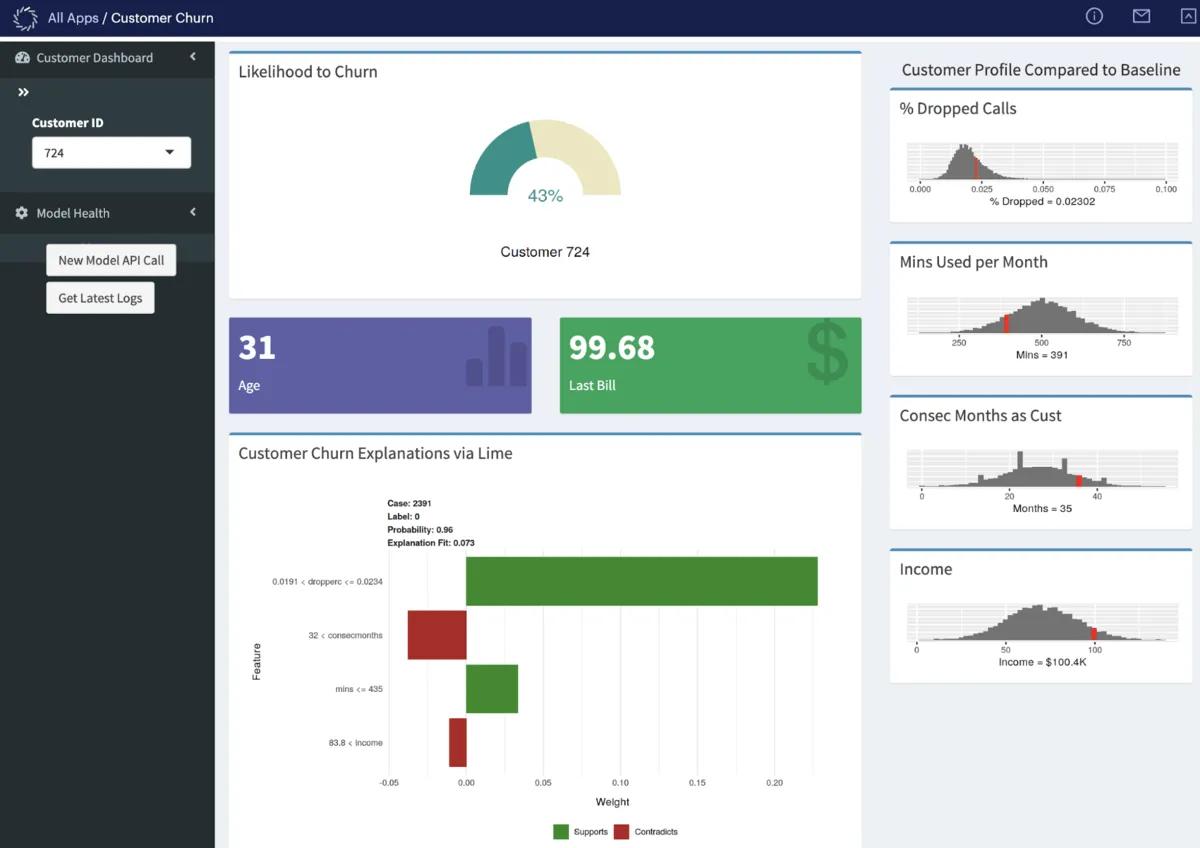
There is currently a lot of hype around data science and especially AI (artificial intelligence). From my 20 years of experience in data science, I’ve found the following definitions to be helpful:
- Data science: A discipline that looks for patterns in complex datasets to build models that predict what may happen in the future and/or explain systems.
- Machine learning: The process of applying algorithms and techniques to build data science models.
- Deep learning: A class of machine learning algorithms that use neural networks with many hidden layers. Deep learning is typically used for image classification and natural language processing.
- AI (artificial intelligence): A category of systems or solutions that operates in a way that is comparable to humans in their degree of autonomy and scope.
To perform data science well, you need a combination of computer/programming skills, math and statistics knowledge, and industry/domain expertise.
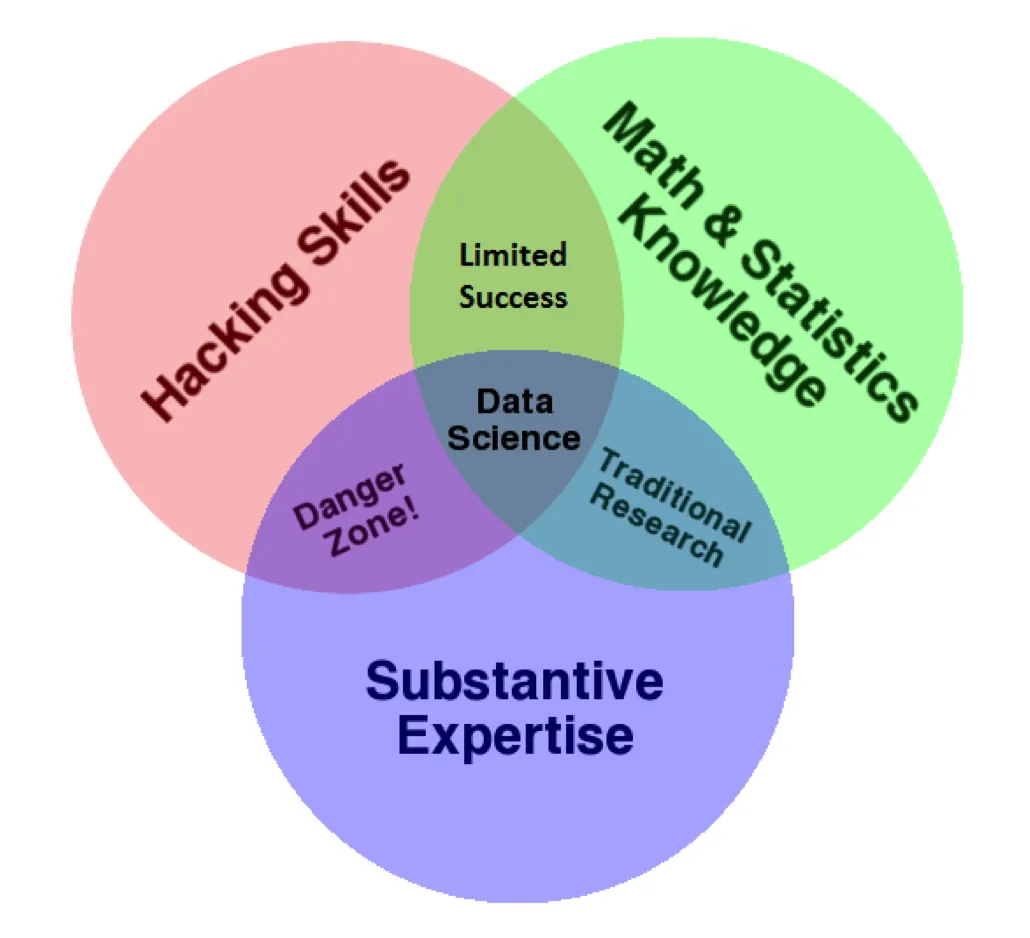
Without math and statistics knowledge, data science models can be misused, and results can be misinterpreted.
Evolution of analytics
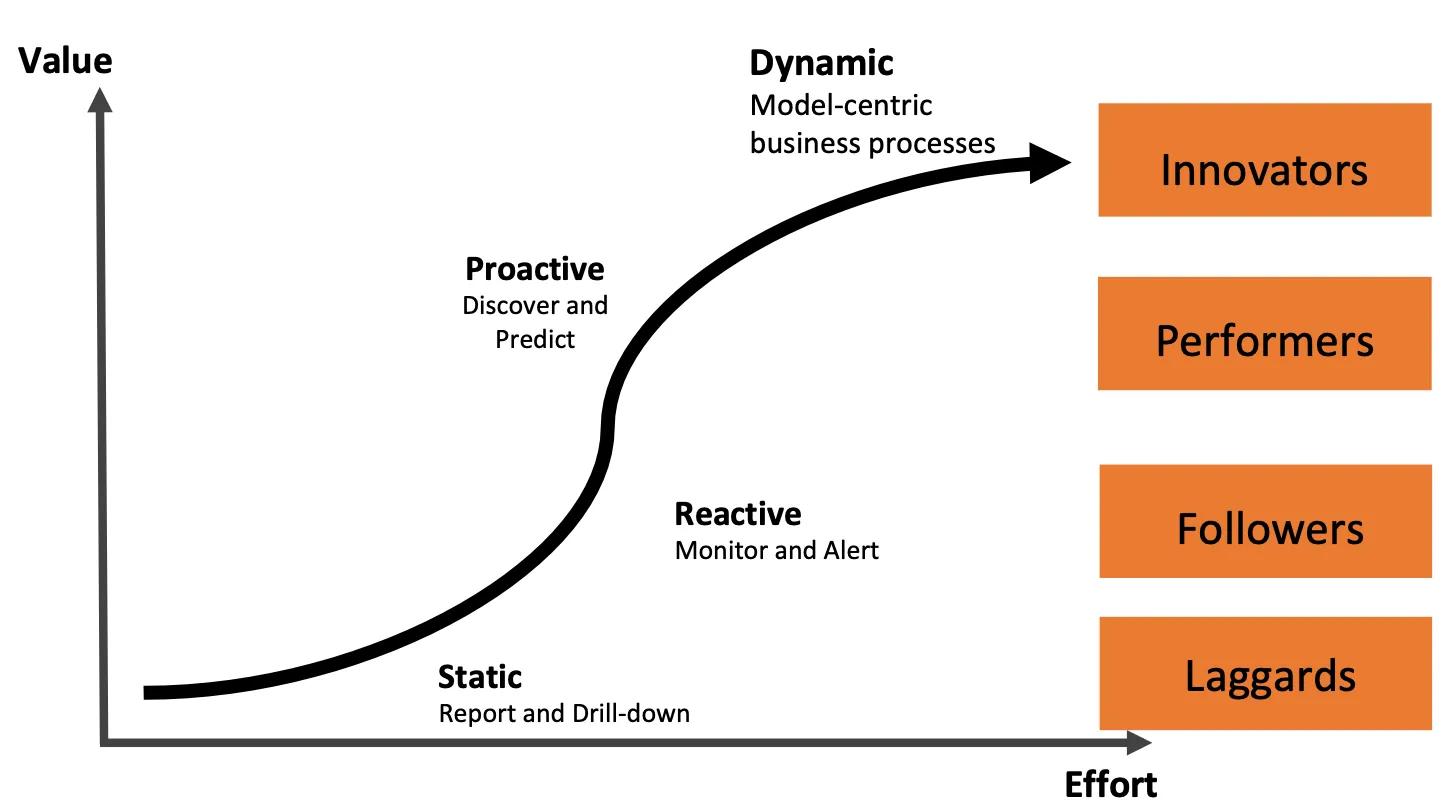
Data science within companies has evolved significantly over the last decade. Most Fortune 500 companies are now at the “Proactive” phase, and are capable of making accurate predictions in certain areas of their business, such as predicting the response rate to direct mail marketing campaigns. The industry is now aspiring to reach the “Dynamic” phase, where their operations are extensively model-driven.
Data science lifecycle
I frequently see six phases in a data science lifecycle.
- Ideation: This is where the project is initially scoped, value/ROI is identified, and a go-no go decision is made about whether or not to invest in a data science project.
- Data acquisition and exploration: This is where promising data sources are identified, data are captured and explored, and then data are prepared (cleansed, combined, etc.).
- Research and development: Once the data are prepared, the team is able to test hypotheses, experiment with different models, and assess the results.
- Validation: This is a quality assurance phase, where a model is validated technically, ethically, and functionally by the business before it is put into production. Companies in highly regulated industries often have whole teams of people who are responsible for model validation, and in some cases, appoint a Chief Compliance Officer.
- Delivery: This is where the model is published. A model could really be any data product. Web applications, integrated API(s), dashboards, reports, and even automated emails are popular form factors.
- Monitoring: Data and behavior change over time, so monitoring data drift, model accuracy, usage, performance, and value are important so problems can be identified early, and models can be improved.
I am now going to walk through how this data science lifecycle applied to a real world project.
Real world example: Applying data science to transportation planning
A few years ago I helped a large city optimize their bus routes. They were trying to encourage citizens to use public transportation, but occasionally there would be a long line at a station, and passengers could not fit on the bus and would be stranded. I was tasked with developing a model so route tables could be optimized two days in advance, large capacity buses could be paired with high demand routes for that day, and people would not be stranded.
The client requested that the entire project, except for the model delivery, be completed in six weeks’ time, which is far too short for a project of this nature. I delivered what I could in that time frame. In a post-mortem of the project, I found it very instructive to review what I was and wasn’t able to deliver. The steps I had to skip due to time pressures are steps that are too often skipped, and provide insights into what actually happens in a data science project.
Ideation phase

Drilling into the Ideation phase, I assessed feasibility and defined the problem statement in a series of sessions with business owners. I did not have time to do a thorough prior art review. This is a critical step because seldom are you working on a problem for the first time, and a lot can be learned from internal and external peers. Quantifying the value/ROI from this project was also neglected. In this case, it would have been feasible to estimate the costs of stranding a passenger and then aggregate the value as stranded passengers decreased.
Data acquisition & exploration phase
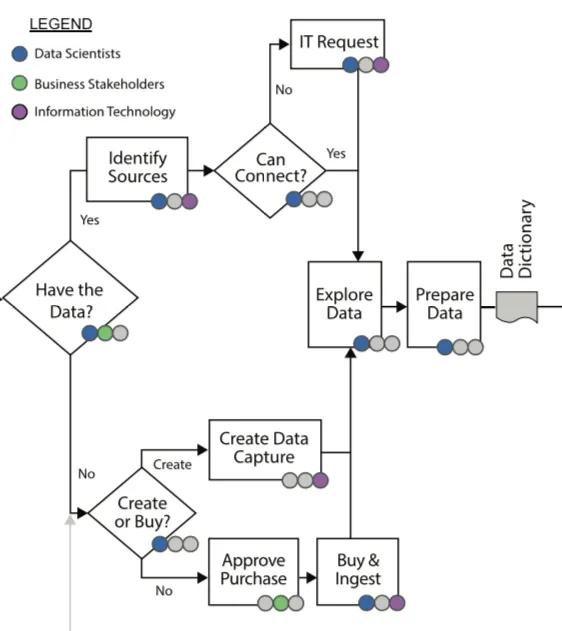
After completing the Ideation Phase, I started exploring and acquiring relevant data. I ended up gathering data from the prior two years on the following:
- Past riders
- Bus Capacity
- Route and Stop Details
- Weather
From these data sources I engineered the following additional features to enrich the dataset:
- Day of Week
- Time of Day
- Season
- Holidays
- Temperature
- Rainfall
- Geography identifiers
I gathered the data from the BI team (who, I found out later, got their data from IT). In hindsight, going directly to the source (IT) would have been better as it turned out that the BI team’s data was not as complete as the original source.
My goal of data preparation was to make each row represent a stop in order to try a numerical prediction model (regression modeling rather than classic time series). Data from prior days for that stop would need to be visible on the row. The image below shows a few of the inputs/columns I engineered. The last three columns were used for graphing and as the target for predictions. The other columns were inputs to the model.

I wish I had access to a platform like Domino back then, as I would have benefitted from the following Domino features:
- Hardware flexibility and choice available to data scientists. Data preparation code can be written on samples of the data using less powerful hardware to save costs and then executed on the entire dataset using more powerful hardware. Unfortunately, the client did not use Domino, so I had to use the more powerful (and expensive) hardware the entire time.
- Documentation and reproducibility. There is just a ton of business and research logic that goes into data preparation. It is one of the most important places for documentation and institutional knowledge. There is only so much you can write down in the comments of a code file. And experiment lineage is near impossible to track manually. Unfortunately, without Domino, we did not have access to any earlier documentation, and future data scientists involved with this transportation agency will not get the complete picture of how the data preparation story unfolded.
Research & development phase
After completing the Data Acquisition & Exploration phase, I started the Research & (Model) Development phase. I tested about 30 algorithms serially on the modeling environment using one machine learning software solution in particular. This was done on datasets with hundreds of millions of rows. I captured the accuracy metrics of each approach, such as RMSE, R-Square, and Residual Analysis.
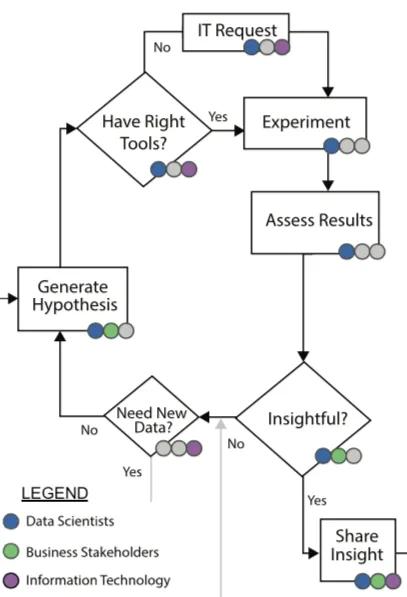
The final model, a regression model with regularization, turned out to be fairly predictive. 80% of the stop-level predictions were within +/- one rider of what actually occurred.
I was happy with those results, but again, I wish I had access to a platform like Domino then. During this model development phase, I would have benefitted from much faster development. Domino supports elastic access to hardware, environments, and code packages, so I could have run parallel execution rather than serial execution of the models. Domino also supports a wide variety of open-source and proprietary algorithms and IDEs that would have helped in my experiments. I likely could have developed a more accurate model without these constraints.
Validation, delivery, and monitoring phases
Validation was not in the scope of this project, due to the time constraints. Leaders should be sure to budget for this increasingly important step in the lifecycle to mitigate model risks. The BI team built a Power BI dashboard on top of the Enterprise Data Warehouse to deliver predicted route capacity and allow exploration of future prediction as well as past results.
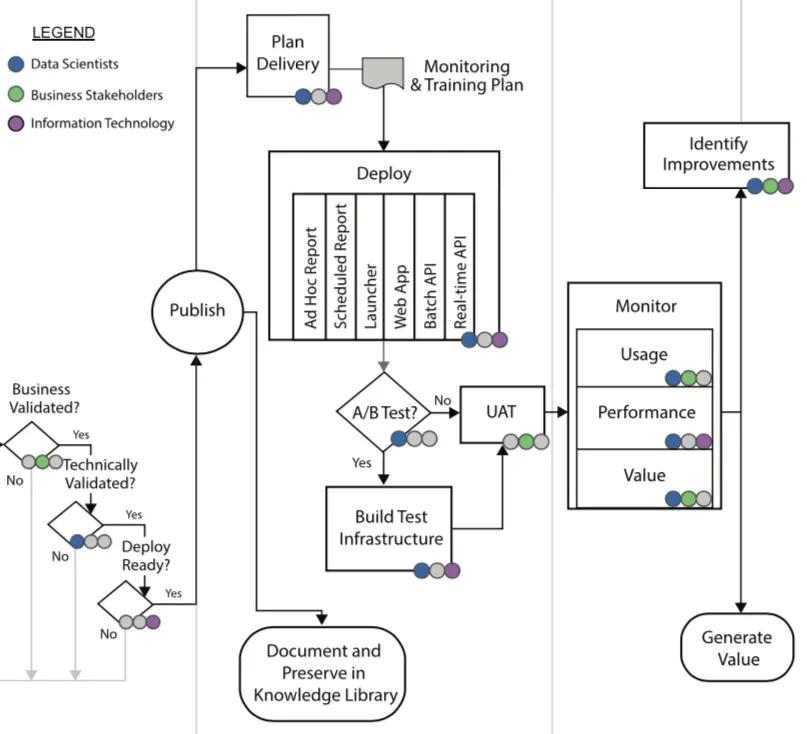
The client could have benefitted from a platform like Domino here for a few reasons:
- Domino could have supported helpful tools to enable an easy transition from Validation to Delivery. For this client, there was a clear and painful break between Validation and Delivery. From the viewpoint of the BI system, the model was a complete black box. Domino is the decoder for how that black box was built and works.
- The delivery team had to recreate much of the work done in the initial modeling, and only had code and a Microsoft Word document to help them. With Domino, reproducibility and versioning of work is automatically captured, and collaboration across teams is greatly improved.
- Also, no one even brought up model monitoring in any team meetings. With Domino Model Monitor, a monitoring tool would have been readily available to ensure ongoing review of model performance, and alignment with business objectives.
Conclusion
Hopefully, this blog gives you a good overview of data science, how it is applied during real world projects, and where corners are usually cut when constraints do not account for reality. Data science can be an extremely powerful tool to solve predictive problems around large data sets.
As your team grows, a data science platform like Domino can be invaluable to applying data science as effectively as possible. Domino can help throughout the process, including:
- Empowering faster data preparation and model testing from flexible, elastic compute environments.
- Encouraging the development of documentation and institutional knowledge that can be modified and deployed.
- Providing ModelOps with full lineage to make the transition from research to validation to deployment painless and transparent.
- Simplifying model monitoring across all data science models with a single pane of glass.
Josh Poduska is the Chief Field Data Scientist at Domino Data Lab and has 20+ years of experience in analytics. Josh has built data science solutions across domains including manufacturing, public sector, and retail. Josh has also managed teams and led data science strategy at multiple companies, and he currently manages Domino’s Field Data Science team. Josh has a Masters in Applied Statistics from Cornell University. You can connect with Josh at https://www.linkedin.com/in/joshpoduska/

