Domino's logo

Who is Domino?

Domino Data Lab empowers the largest AI-driven enterprises to build and operate AI at scale. Domino’s Enterprise AI Platform provides an integrated experience encompassing model development, MLOps, collaboration, and governance. With Domino, global enterprises can develop better medicines, grow more productive crops, develop more competitive products, and more. Founded in 2013, Domino is backed by Sequoia Capital, Coatue Management, NVIDIA, Snowflake, and other leading investors.

Watch Demo
  • Platform

      • AI infrastructure
      • Data management
      • AI workbench
      • MLOps
      • AI governance
      • FinOps
      • Pricing
      • Security & compliance
      • What's new
  • Solutions

    • Industries

      • Life sciences
      • Finance
      • Public sector
      • Retail
      • Manufacturing
    • Use Cases

      • Generative AI
      • Cost-effective data science
      • Self-service data science
      • Model risk management
      • Cloud data science
  • Learn

      • Events
      • Blog
      • Podcast
      • Courses and certifications
      • Data Science Dictionary
      • Documentation
      • Support
      • Demo hub
  • Company

      • About
      • Why Domino
      • Careers
      • News and press
      • Partners
      • Customers
      • Contact us

© 2026 Domino Data Lab, Inc. Made in San Francisco.

  • Do not sell my personal information
  • Privacy policy
  • Terms and conditions
  • Security
  • Legal
Home
Contact us
Watch Demo
Contact us
Watch Demo
  • Agentic AI
  • AI Governance
  • Airflow
  • Anaconda
  • Apache Spark
  • Artificial Intelligence
  • Clustering
  • Dask
  • Data Science
  • Density-based clustering
  • dplyr
  • Factor analysis
  • Feature
  • Feature Engineering
  • Feature Extraction
  • Feature selection
  • Folium
  • GenomicRanges
  • ggmap
  • ggplot
  • GPU
  • Ground Truth
  • Hash table
  • Hyperparameter Tuning
  • Interpretability
  • Jupyter Notebook
  • Kubernetes
  • LLMOps
  • Machine Learning
  • Machine Learning Algorithms
  • MLOps
  • Model Drift
  • Model Evaluation
  • Model monitoring
  • Model Selection
  • Model Tuning
  • Overfitting
  • Plotly
  • PySpark
  • PyTorch
  • Responsible AI
  • Shiny (in R)
  • sklearn
  • spaCy
  • SR 26-2
  • Statistical Computing Environment (SCE)
  • TensorFlow
  • Underfitting
  • XGBoost
  • ggplot

    What is ggplot2?

    ggplot2 is a data visualization package for the statistical programming language R. ggplot2 is an implementation of Leland Wilkinson’s Grammar of Graphics—a scheme for data visualization which breaks up graphs into semantic components such as scales and layers. ggplot2 is an alternative to the base graphics in R, and contains a number of plotting defaults.

    Since Hadley Wickham created ggplot2 in 2005, it has grown in use to become one of the most popular R packages. ggplot2 is a system for declaratively creating graphics, based on The Grammar of Graphics. You provide the data, tell ggplot2 how to map variables to aesthetics, what graphical primitives to use, and it takes care of the details. For example, ggplot2 can map values to the x-axis and y-axis, map different variables to different colors, and display best-fit lines by default.

    In contrast to base R graphics, ggplot2 allows you to add, remove or alter components in a plot at a high level of abstraction. ggplot2’s popularity is likely due in large part to the defaults being aesthetically pleasing, at least relative to most programming software. To see an example of this, let’s say you have a dataset of the R programmers with the most programs downloaded during a given month:
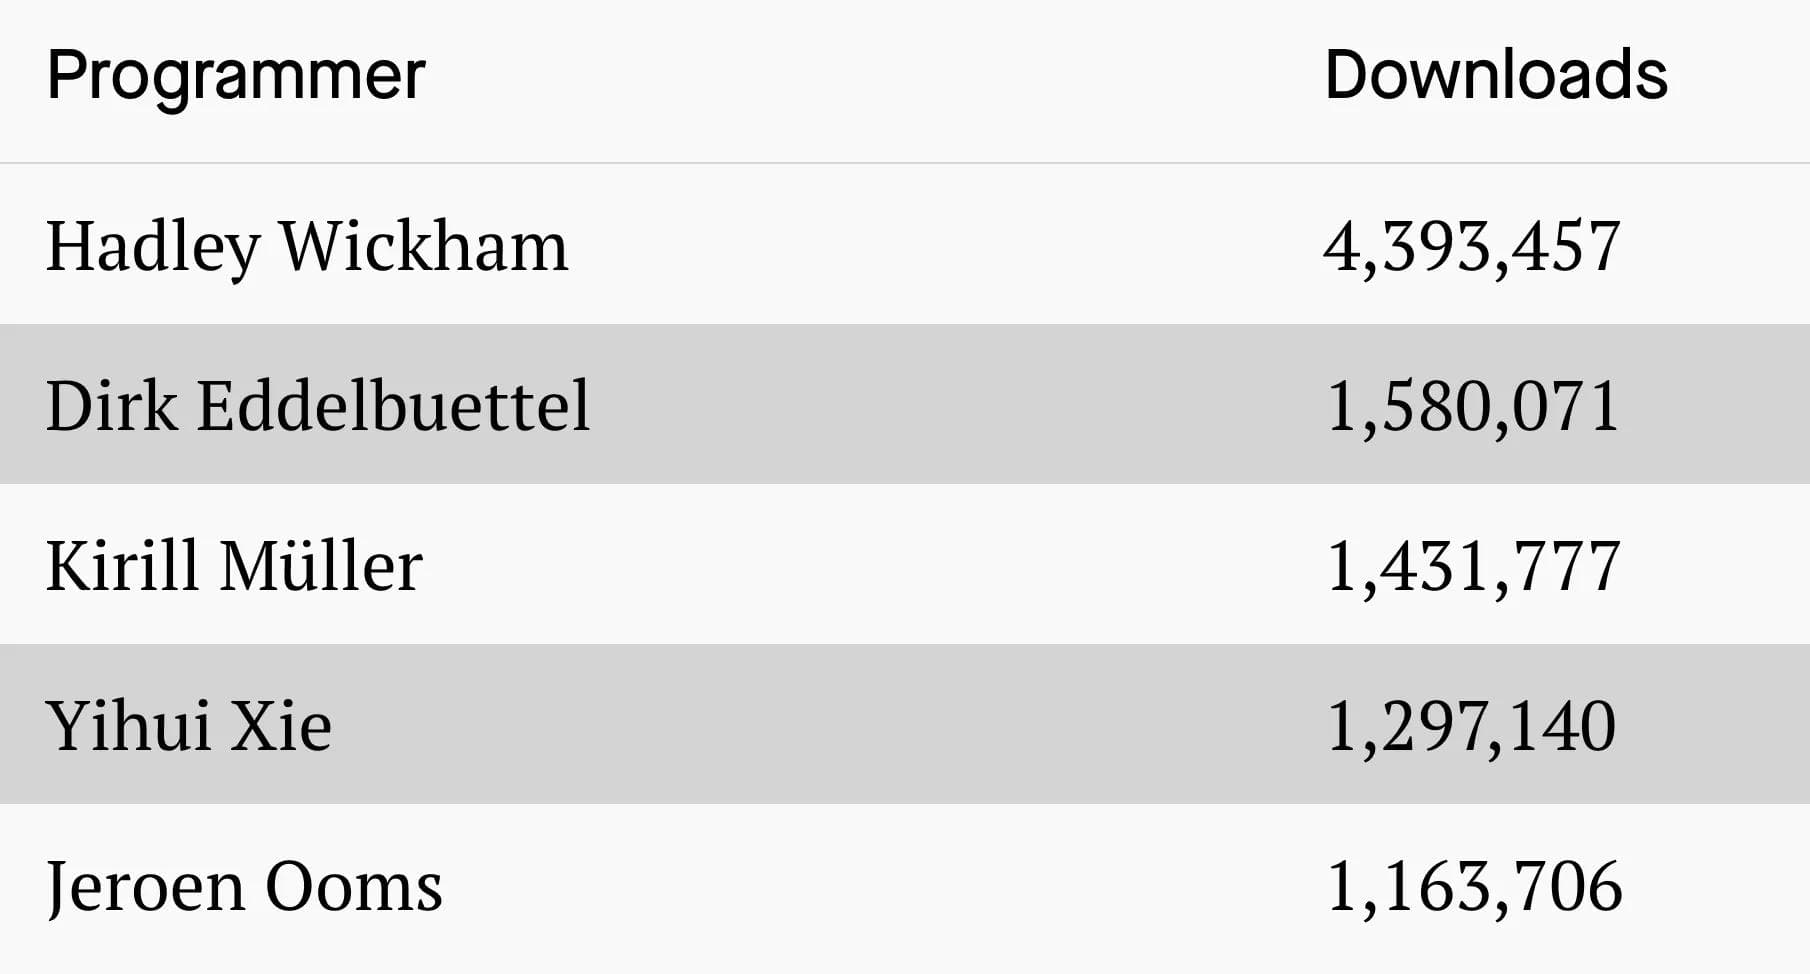
    R programmer data of downloads
    R programmer data of downloads

    The code to make the following decent looking column chart is relatively straightforward:

    ggplot(dataset, aes(x = Programmer, y = Downloads)) + geom_col()

    Example of ggplot2’s aesthetically-pleasing default settings
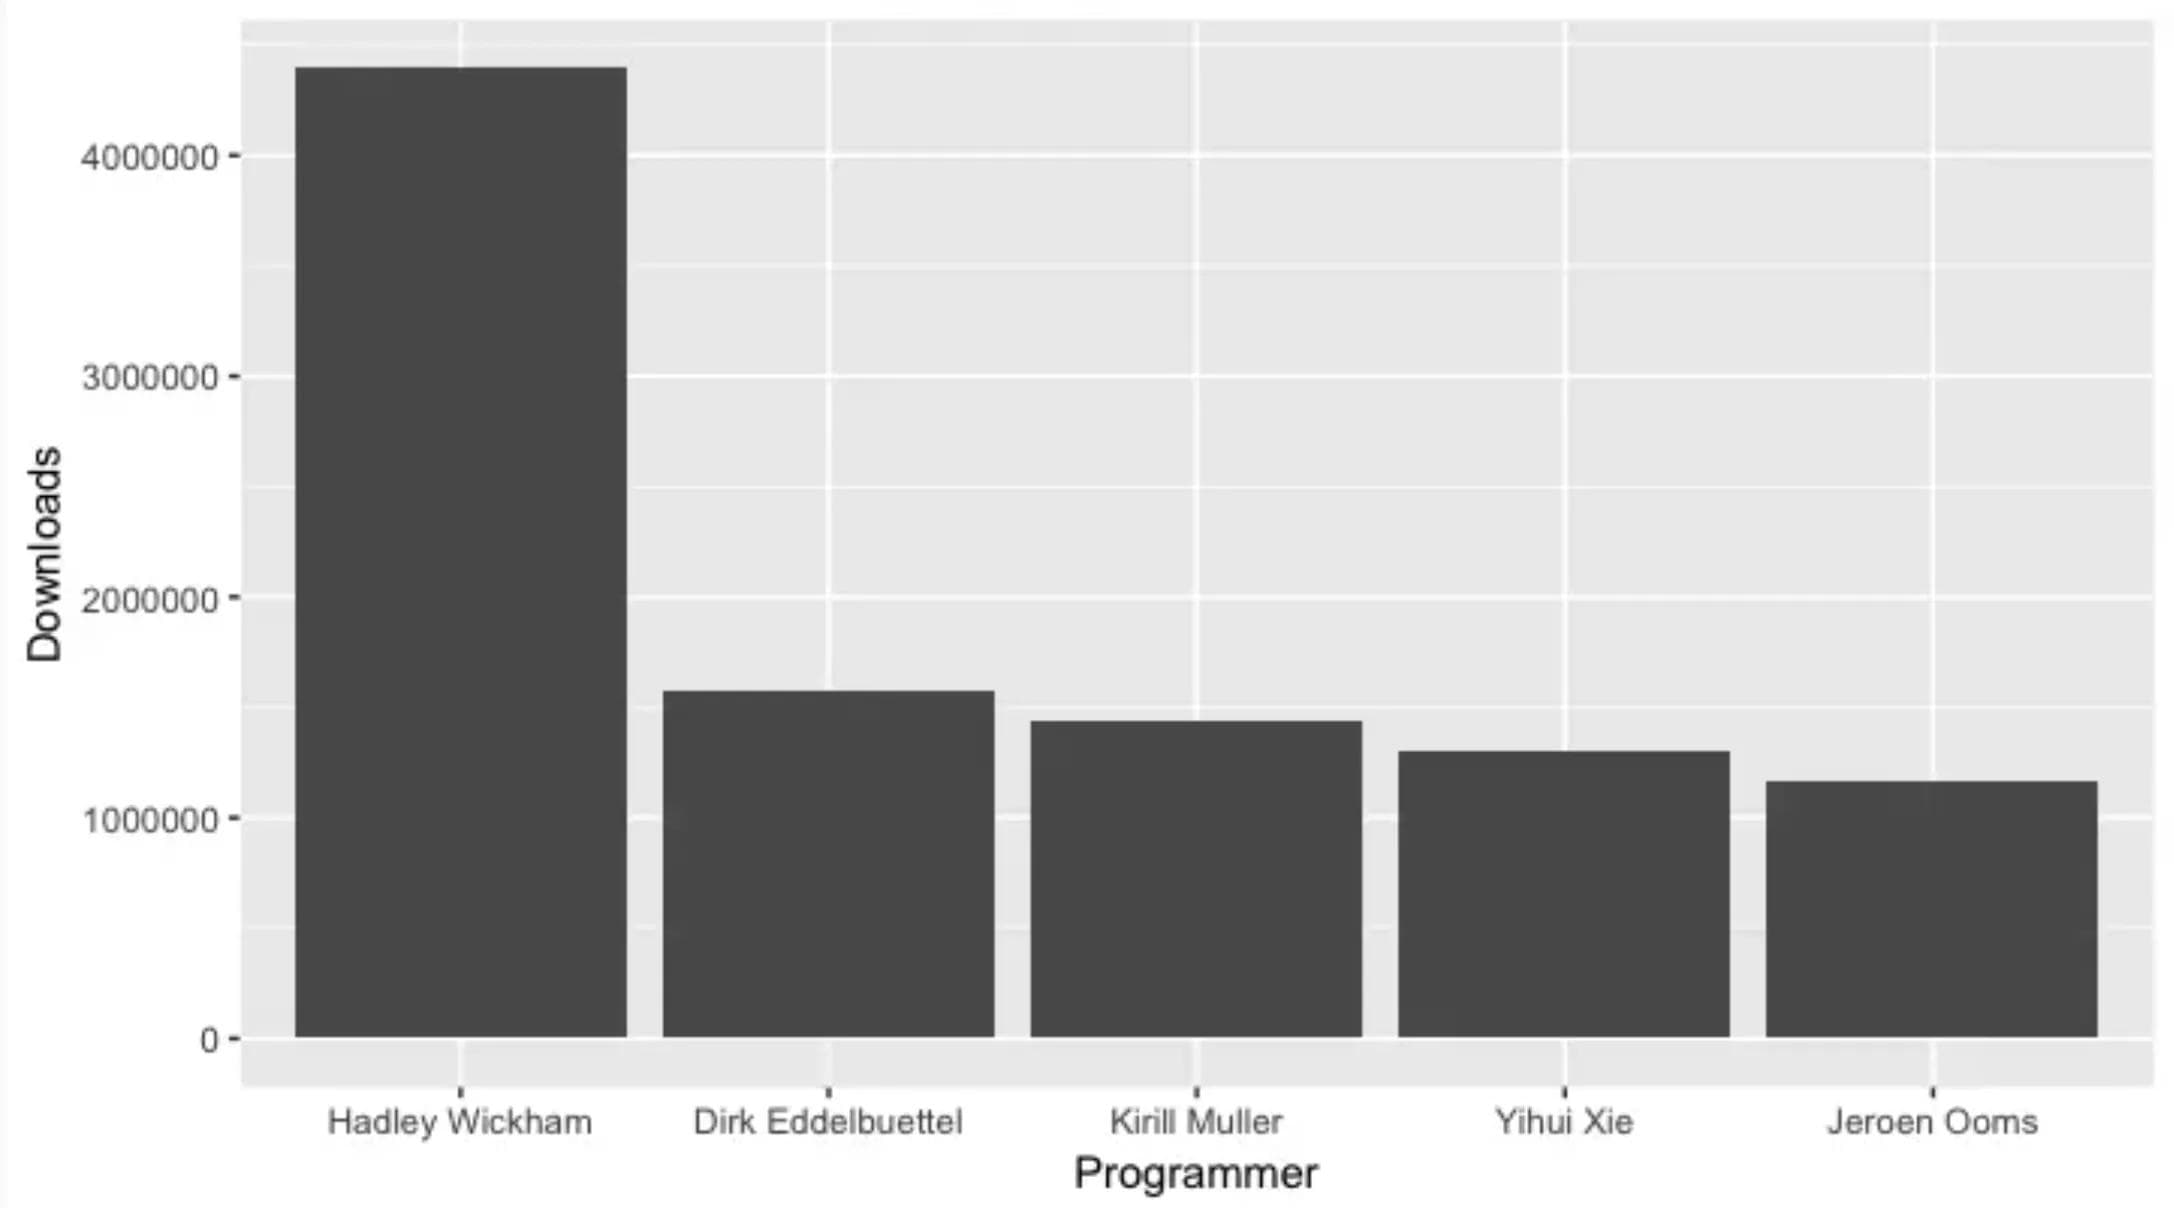
    bar chart generated by ggplot2
    bar chart generated by ggplot2

    Source: Quartz

    Base plotting in R, on the other hand, is imperative. You set up your layout(), you add points for a variable along with a title, and then you fit and plot a best-fit-line for the first variable, and then the second variable, and so on. Then you go on to the next plot. After several repetitions, you end with a legend.

    Installation

    The easiest way to get ggplot2 is to install the whole tidyverse:

    install.packages("tidyverse")

    Alternatively, you can install just ggplot2:

    install.packages("ggplot2")

    Summary

    • Example of ggplot2’s aesthetically-pleasing default settings
    • Installation