Model Evaluation
What is model evaluation?
Model evaluation is the process of using different evaluation metrics to understand a machine learning model’s performance, as well as its strengths and weaknesses. Model evaluation is important to assess the efficacy of a model during initial research phases, and it also plays a role in model monitoring.
To understand if your model(s) is working well with new data, you can leverage a number of evaluation metrics.
Classification
The most popular metrics for measuring classification performance include accuracy, precision, confusion matrix, log-loss, and AUC (area under the ROC curve).
- Accuracy measures how often the classifier makes the correct predictions, as it is the ratio between the number of correct predictions and the total number of predictions.
- Precision measures the proportion of predicted Positives that are truly Positive. Precision is a good choice of evaluation metrics when you want to be very sure of your prediction. For example, if you are building a system to predict whether to decrease the credit limit on a particular account, you want to be very sure about the prediction or it may result in customer dissatisfaction.
- A confusion matrix (or confusion table) shows a more detailed breakdown of correct and incorrect classifications for each class. Using a confusion matrix is useful when you want to understand the distinction between classes, particularly when the cost of misclassification might differ for the two classes, or you have a lot more test data on one class than the other. For example, the consequences of making a false positive or false negative in a cancer diagnosis are very different.
Example of confusion matrix on iris flower dataset
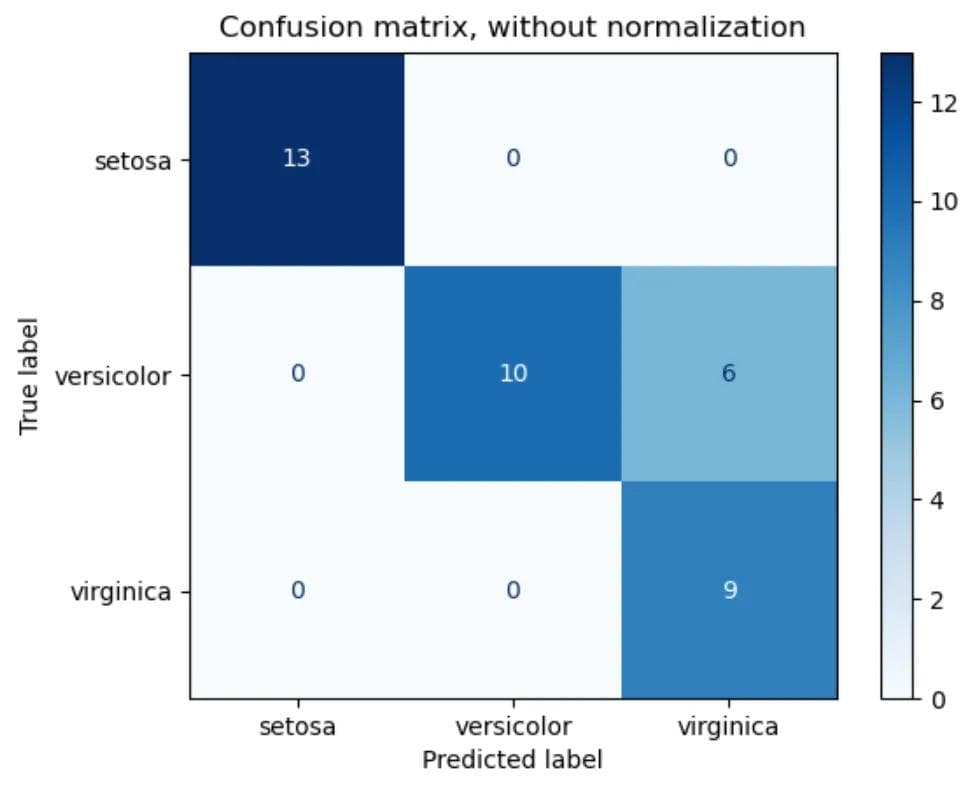
Source: scikit-learn
- Log-loss (logarithmic loss) can be used if the raw output of the classifier is a numeric probability instead of a class label. The probability can be understood as a gauge of confidence, as it is a measurement of accuracy.
- AUC (Area Under the ROC Curve) is a performance measurement for classification problems at various thresholds settings. It tells how much a model is capable of distinguishing between classes. The higher the AUC, better the model is at predicting when a 0 is actually a 0 and a 1 is actually a 1. Similarly, the higher the AUC, the better the model is at distinguishing between patients with a disease and with no disease.
Other popular metrics exist for regression models, like R Square, Adjusted R Square, MSE (Mean Squared Error), RMSE (Root Mean Squared Error), and MAE (Mean Absolute Error).
Domino Model Monitor
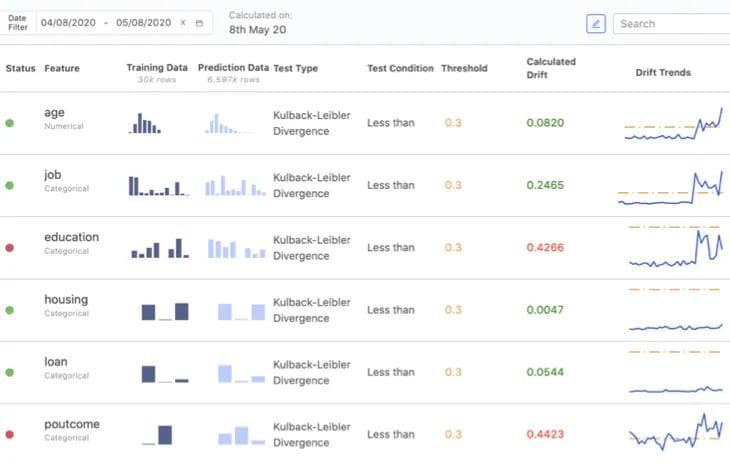
Machine learning operations teams often monitor multiple models at once by checking model predictions, checking (input) data drift, and checking concept drift. Model monitoring tools, like Domino Model Monitor, are available to facilitate model evaluation.